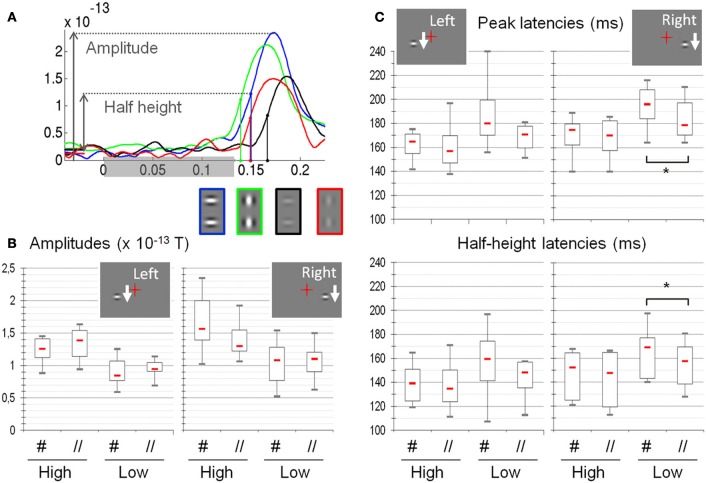
Figure 4.
Amplitude, latency and half-height latency measured on the MEG signals as a function of the different experimental conditions (N = 8). (A) Example of individual time courses (subject S6, responses to right presentation conditions) averaged over selected sensors. The color of the curve codes for the experimental condition, reminded below (green: High //, blue: High #, red: Low //, black: Low #). The shaded rectangle on the horizontal axis shows the whole period of stimulation. (B) Amplitudes: High-contrast stimuli elicit larger responses than low-contrast stimuli. Stimulus orientation does not significantly modulate the response amplitude. (C) Latencies: The peak latencies and the half-height latencies are shorter for high as compared to low-contrast stimuli. At low contrast, response latencies are shorter for the parallel as compared to the orthogonal orientation, although this difference is significant only for right presentation (asterisks). Red dash: median values; box: interquartile range; whiskers: full range. See text for details.

