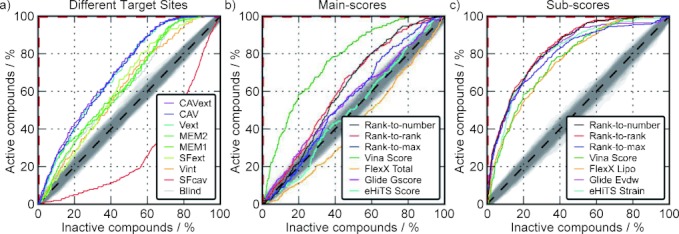
Figure 1.

ROC curves a) with respect to different putative binding sites based on Vina Scores; b) ROC curves with respect to the inner cavity of the main scores; and c) scoring function sub-terms, as well as the ROC curves from the respective consensus scores. ROC curves of random distributions are expected in the grey area around the diagonal dashed lines. A perfect ranking corresponds to the red dashed lines.
