Figure 2.

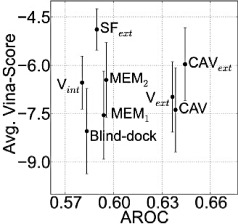
Average Vina Scores over the AROC of different putative binding sites. Error bars reflect the standard deviation of the scores.

Average Vina Scores over the AROC of different putative binding sites. Error bars reflect the standard deviation of the scores.