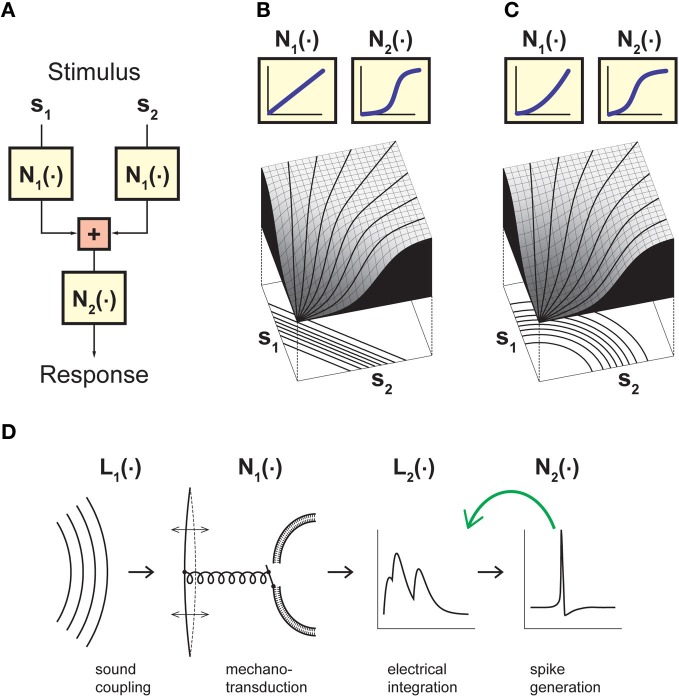
Figure 1.
Model framework for analyzing neuronal stimulus integration with iso-response measurements. (A) A canonical model for separating non-linear effects before and after stimulus integration. The model considers two (or more) separate inputs s1…sn, which each undergo a non-linearity N1 before summation, and a final output non-linearity N2. Stimulus integration is governed by the non-linearity N1, whereas N2 provides a transformation of the integrated signal. Assessing the nature of stimulus integration thus amounts to measuring N1 independently of N2. (B) Model responses obtained with linear stimulus integration and sigmoidal output transformation. The response surface is dominated by the sigmoidal shape of the output non-linearity, but the iso-response curves shown below the surface plot are straight lines and thus reveal the linear nature of stimulus integration in this model. (C) Same as (B), but with a quadratic non-linearity N1 and thus non-linear stimulus integration. While the response surface is still dominated by a sigmoidal shape, the iso-response curves are now circles and thus reveal the quadratic non-linearity relevant for stimulus integration. The non-linearities N2 in (B) and (C) were adjusted such that if s1 or s2 are presented alone, the input-output relations are identical in the two models. (D) A cascade model for sound transduction, consisting of two linear filters L1 and L2 and two non-linear transformations N1 and N2. The green arrow indicates that the cascade may also include a feedback mechanism, corresponding to adaptation induced by the neuron's spiking activity. Panels (B) and (C) adapted from Gollisch and Herz (2003) with permission, Copyright (2003), Frankfurt Institute for Advanced Studies. Panel (D) adapted from Gollisch and Herz (2005) according to the Creative Commons Attribution License.

