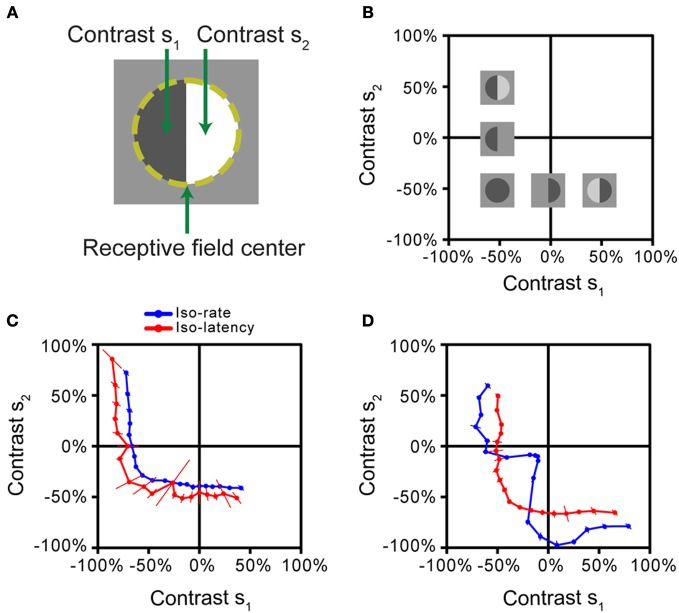
Figure 4.
Iso-response measurements of spatial stimulus integration by retinal ganglion cells. (A) Stimulus pattern used in the measurements. After determining the receptive field center of a retinal ganglion cell (dashed line), different contrast levels s1 and s2 were simultaneously displayed for 500 ms, each in one half of the receptive field. (B) Stimulus space. Iso-response stimuli were measured in the space spanned by s1 and s2. Experiments were performed on Off-type ganglion cells, which best respond to negative contrast. Several sample stimulus patterns are shown at their respective locations in stimulus space. The origin corresponds to the gray level of background illumination. (C) Iso-rate and iso-latency curves for a sample ganglion cell, corresponding to the majority of recorded cells in the salamander retina. Both iso-response curves have similar shapes that indicate a threshold-quadratic non-linearity of stimulus integration. (D) Iso-rate and iso-latency curves for a different ganglion cell from a subpopulation in the salamander retina. While the iso-latency curve has a similar shape as the curves in (C), the iso-rate curve shows a notch along the lower-left diagonal, corresponding to particular sensitivity to homogeneous stimulation of the receptive field. This follows from a dynamic local gain control mechanism, mediated by inhibitory interactions. All panels reprinted from Bölinger and Gollisch (2012), Copyright (2012), with permission from Elsevier.

