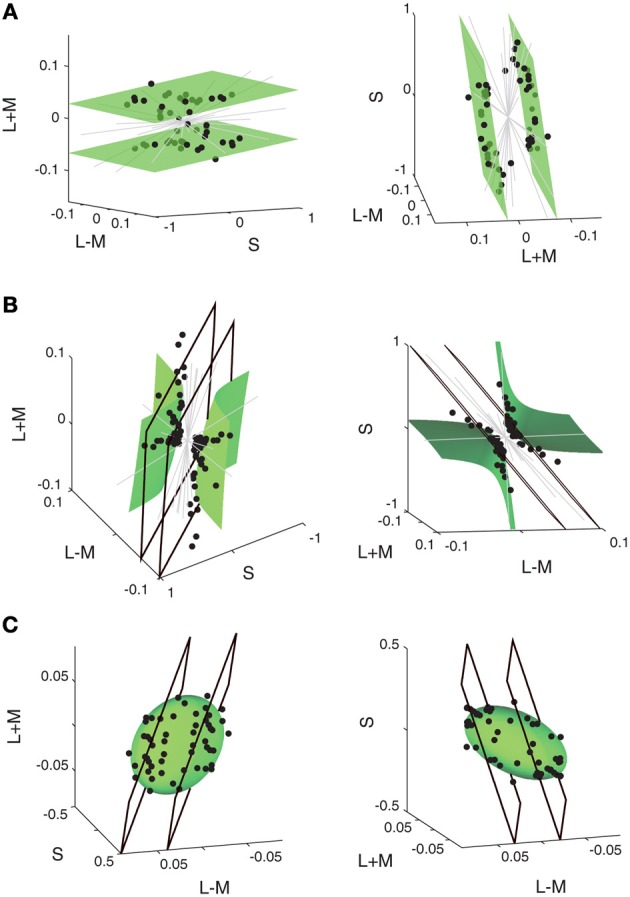
Figure 5.

Iso-response measurements of integration of cone signals by neurons in macaque primary visual cortex. The panels show iso-response stimuli (black circles) obtained with drifting chromatic gratings for three representative sample cells in (A), (B), and (C), respectively. Stimuli that yielded the same firing rate are plotted in the space spanned by S-cone activation (S) and by the sum and difference of L-cone and M-cone activation (L + M and L − M, respectively). For each cell, the data are shown in the 3D plots for two different viewpoints (left and right column, respectively). Gray lines indicate directions in stimulus space along which the predefined response criterion could not be reached. As shown by the green surface plots, iso-response stimuli are well fitted by a linear plane for the cell in (A), by a hyperboloid for the cell in (B), and by an ellipsoid for the cell in (C). Panels (B) and (C) also show best fits of linear planes (black quadrangles), which do not provide good descriptions of the iso-response stimuli. Reprinted by permission from Macmillan Publishers Ltd: Nature Neuroscience (Horwitz and Hass, 2012), copyright (2012).
