Figure 6.

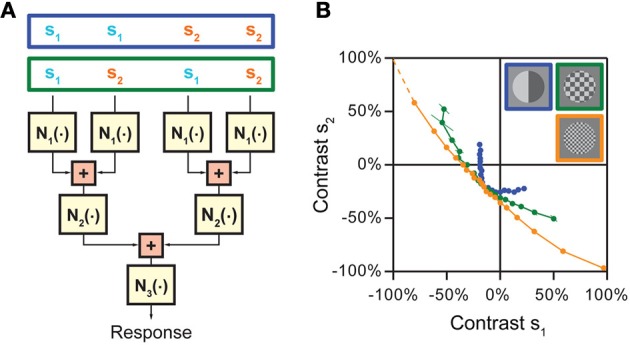
Approach for disentangling non-linearities at multiple stages of stimulus integration in hierarchical models. (A) Cascade model with three consecutive non-linear stages, N1, N2, and N3, separated by two integration stages. The model assumes that first nearby stimulus components are integrated, whose results are then combined in a subsequent stage. Different stimulation schemes that can be used to separate the effects of the non-linearities are shown on top. When nearby input channels are stimulated with the same stimulus component s1 or s2, respectively (stimulus pattern in blue box), the iso-response curve is affected by the combination of N1 and N2. When the two stimulus components s1 and s2 are placed so that they are combined already by the first integration stage (stimulus pattern in green box), only non-linearity N1 is relevant for the shape of the iso-response curve. (B) Application of the strategy to separate different integration stages of spatial integration by retinal ganglion cells. When nearby spatial locations receive the same contrast (blue data points), the iso-rate curve shows the standard threshold-quadratic non-linearity as in Figure 4C. When the two contrast components s1 and s2 are interleaved so that presynaptic bipolar cells typically already start integrating the two components, but individual photoreceptors only receive either one of the components (green and orange data points, corresponding to squares in the stimulus layout with 150 and 60 μm side length, respectively), the iso-rate curves approach straight lines, showing that the integration stage from photoreceptors to bipolar cells can be approximated as linear integration. Panel (B) reprinted from Bölinger and Gollisch (2012), Copyright (2012), with permission from Elsevier.
