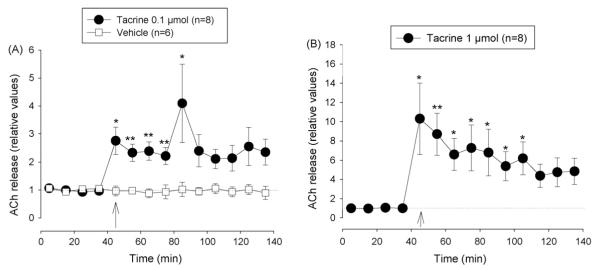
Fig. 6.
Effect of tacrine and vehicle (CSF) on extracellular ACh concentration in the nucleus accumbens. (A) Vehicle and 0.1 μmol tacrine, (B) 1 μmol tacrine. Arrows indicate time when i.c.v. injection (20 μl at 2 μl/min) was started. Data are shown as relative values of basal release which is the mean of four pre-injection samples. Basal release is taken as 1.0 and indicated by a dotted line. *p < 0.05, Friedman’s analysis of variance followed by Dunn’s multiple comparisons test using the pre-injection sample as control.

