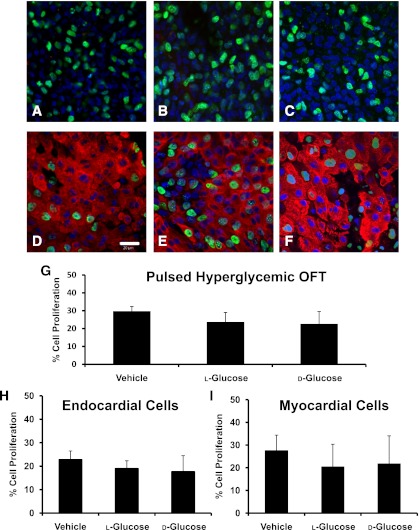
FIG. 2.
Confocal images indicating the proliferating cells for the pulsed hyperglycemic condition. The nuclei of the proliferating endocardial cells for the vehicle-treated (A), l-glucose–treated (B), and d-glucose–treated (C) OFTs are indicated by the green stain. Myocardial cell proliferation for vehicle (D), l-glucose (E), and d-glucose (F) is designated by the green nuclear stain (Alexa Fluor 488) with the red myosin stain (Alexa Fluor 564) to differentiate the cell type. Original magnification 400×. Scale bar represents 20 µm. The percentage of volumetric (G), endocardial cell (H), and myocardial cell (I) proliferation in the OFTs of HH24 embryos for pulsed additions of vehicle, l-glucose, and d-glucose are shown. Data are mean ± SD for n = 10.

