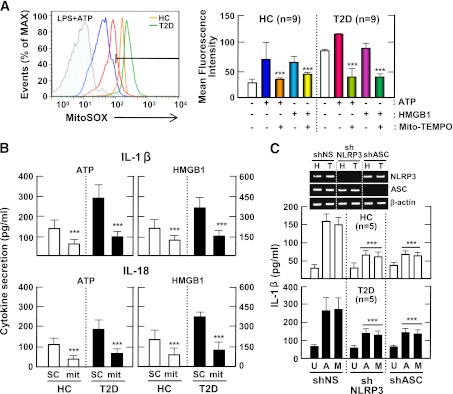
FIG. 3.
Upregulated NLRP3 inflammasome activation in patients with type 2 diabetes (T2D) is mediated by mitochondrial ROS. A: PBMCs isolated from T2D patients (n = 9) and healthy controls (HCs; n = 9) were primed with LPS (10 ng/mL) for 4 h and then stimulated with ATP (1 mmol/L) or HMGB1 (10 ng/mL) for 1 h in the absence or presence of Mito-TEMPO (mit; 200 μmol/L). Then, the cells were stained with MitoSOX, gated for the CD14+ population, and analyzed by flow cytometry. Representative images (left) and quantitative analysis of mean fluorescence intensities (right) are shown (A, right). Data are expressed as means ± SEM. B: MDMs from T2D patients (n = 5) and HCs (n = 5) were primed with LPS (10 ng/mL, for 4 h), and then stimulated with ATP (1 mmol/L) or HMGB1 (10 ng/mL) for 1 h in the absence or presence of Mito-TEMPO (mit; 200 μmol/L). C: MDMs from T2D patients (n = 5) and HCs (n = 5) were transduced with nonspecific control shRNA lentiviral particles (shNS) or lentiviral shRNA specific for NLRP3 (shNLRP3) or ASC (shASC), primed with LPS, and stimulated with ATP (1 mmol/L for 1 h) or MSU (100 μg/mL for 6 h). ELISA analysis of IL-1β (B and C) and IL-18 (B). Data are expressed as means ± SEM. C: Representative images of gels run to assess transduction efficiency by semiquantitative RT-PCR analysis (top). ***P < 0.001 vs. HCs. U, untreated; A, ATP; M, MSU; SC, solvent control.

