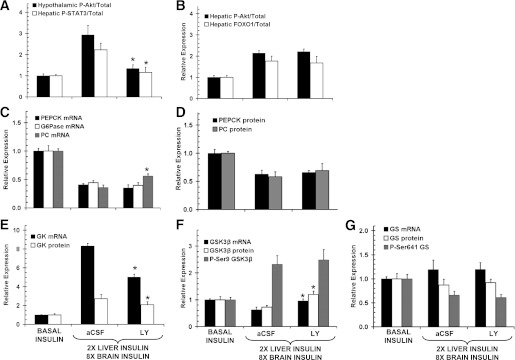
FIG. 6.
Molecular response to hyperinsulinemia (two times liver, eightfold brain) for animals characterized in Fig. 5. Hypothalamic insulin signaling indices (A) and hepatic insulin signaling indices (B) are shown. Hepatic gluconeogenic mRNA (C) and protein (D) expression are shown. Glucokinase mRNA and protein expression (E); GSK3β mRNA, protein, and phosphorylation levels (F); and GS mRNA, protein, and phosphorylation levels (G) are shown. Representative Western blots can be found in Supplemental Fig. 6. Values are means ± SEM; n values are the same as in Fig. 5. *P < 0.05 difference versus the aCSF-treated hyperinsulinemic group.

