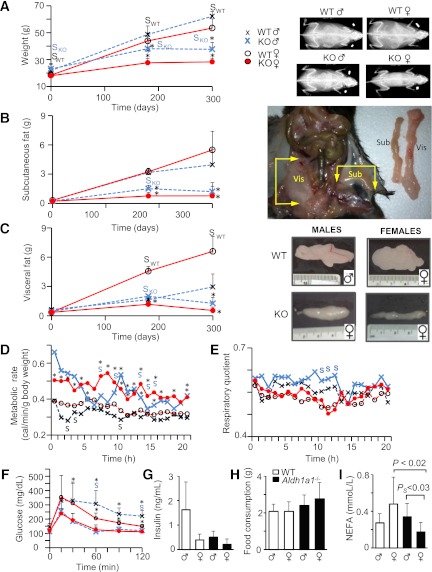
FIG. 1.
Deficiency in Aldh1a1 suppresses fat accumulation in response to HF feeding in a depot- and sex-specific manner. A: Whole-body weights are shown in WT (males, small black X, n = 18; females, open circles, n = 17) and Aldh1a1−/− (males, large blue X, n = 18; females, closed red circles, n = 23) on RC; in WT (males, n = 8; females, n = 9) and Aldh1a1−/− (males, n = 9; females, n = 11) mice on an HF diet for 180 days; and in WT (males, n = 7; females, n = 9) and Aldh1a1−/− (males, n = 9; females, n = 9) mice for 300 days. *P < 0.001 differences between genotypes; SWT (black) or knockout (KO; blue), differences between sexes within one genotype. X-ray images showed randomly selected mice from each group on a regular and HF diet for 180 days. Subcutaneous (B) and visceral (perigonadal) (C) fat pads were dissected as shown in the insets at right: WT (males, n = 9; females, n = 8) and Aldh1a1−/− (KO; males, n = 9; females, n = 8) on RC; in WT (males, n = 5 and females, n = 5) and in Aldh1a1−/− (males, n = 4; females, n = 4) mice on an HF diet for 180 days; in WT (males, n = 7; females, n = 9) and Aldh1a1−/− (males, n = 9 and females, n = 9) mice for 300 days. *P < 0.001 differences between genotypes in the same sex-group; SDifferences between sexes within one genotype. Images show one VF pad dissected from randomly selected WT and KO male and female mice that consumed an HF diet for 180 days. Metabolic rate (D) and RQ (E) in WT (dashed line, males [blue X, n = 4] and females [red circles, n = 5]) and Aldh1a1−/− (solid line, males [n = 3] and females [n = 5]). Data were calculated [Weir equation (50)] based on food and oxygen consumption as well as CO2 release in metabolic cages. *P < 0.05 differences between genotypes; PS, P < 0.05, differences between sexes within one genotype (black font, WT; blue font, KO). Mann-Whitney U test (for panels D–F). F: GTT in WT (dashed line, males [blue Xs, n = 6] and females [red circles, n = 7]) and Aldh1a1−/− (solid line, males [n = 9] and females [n = 8]). G: Insulin was measured in plasma of fasted mice on an HF diet by ELISA (WT, n = 5; KO, n = 4/sex-group). H: Food consumption was measured in WT (white bars) and Aldh1a1−/− (black bars) mice in metabolic cages (n = 5 in all groups). The values among groups were not statistically different. I: NEFA were measured in same plasma as insulin (G). Sub, subcutaneous fat; Vis, VF. Throughout figure legends, data are shown as mean ± SD, and statistical differences were examined by two-way ANOVA unless otherwise indicated. (A high-quality digital representation of this figure is available in the online issue.)

