FIG. 4.
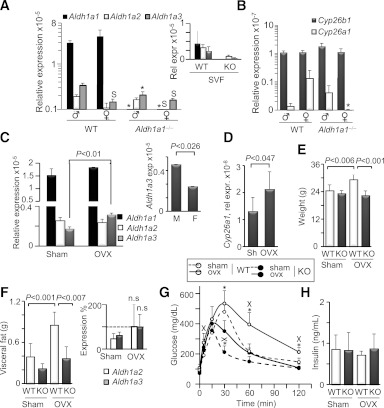
Estrogen contributes to sex-specific expression of Aldh1 enzymes in VF. Relative expression (Rel expr) of RA-generating Aldh1 enzymes (A) and RARE containing RA target genes Cyp26A1 and Cyp26B1 (B) in VF isolated from WT male (n = 5), female (n = 4), and Aldh1a1−/− male and female mice (both n = 4) on an HF diet (180 days). All data are shown as mean ± SE. *P < 0.001 differences between genotypes in the same sex-group; SP < 0.05, significant differences between sexes within one genotype. Inset in A shows Aldh1 expression in SVF fraction in age-matched females on RC (same n = 3/group as in Fig. 2B). Relative expression of Aldh1 enzymes (C) and Cyp26A1 (D) enzymes was measured in VF isolated from sham-operated (Sh; n = 5) and ovariectomized (OVX; n = 4) WT female mice (same study as Fig. 3B). Inset shows Aldh1 expression (exp) in WT male (M; n = 4) and female (F; n = 5) group on a regular diet (same as in Fig. 1, 0 time). Data are shown as mean ± SD. P value was determined by Mann-Whitney U test. Weight (E) and VF mass (F) in sham-operated and ovariectomized WT (Sham, n = 10; OVX, n = 8) and Aldh1a1−/− (Sham, n = 9; OVX, n = 5) mice. Inset shows expression levels of Aldh1a2 and -a3 enzymes in sham and OVX Aldh1a1−/− mice (n = 5/group). Data are shown as percentage of values seen in WT sham-operated mice (dashed line). G: GTT in WT (open circles; sham, dashed and ovx, solid lines) and Aldh1a1−/− (closed circles; sham, dashed and ovx, solid lines) mice (n = 4 in WT sham and n = 5 in all other groups). *P < 0.001 differences between genotypes in sham or OVX group; Xdifferences (P < 0.04 or less) between sham and OVX mice within one genotype. H: Insulin levels were measured by ELISA in plasma isolated from sham-operated and OVX WT and Aldh1a1−/− mice (n = 4/group). Insulin levels were not significantly different (Mann-Whitney U test). n.s., not significantly different by two-way ANOVA.

