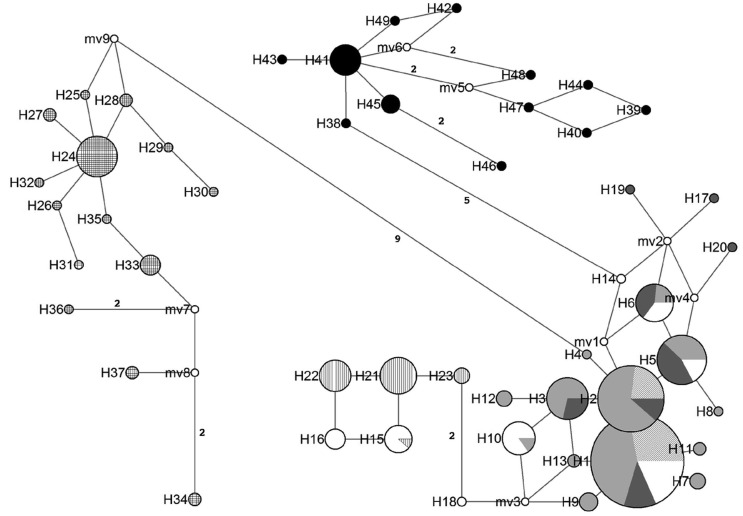
Figure 3.
Haplotype network in which each circle represents a different haplotype (as labeled) and the circle size is proportional to its recorded frequency (based on all samples). The length of the branch joining different haplotypes is proportional to the number of mutations that separate them. The number of mutations is indicated in each branch, except where only a single mutation is involved. The relative frequencies of the haplotypes in each population are represented by different types of shading:diagonal stripes = northwestern Atlantic (SC and GA); light gray = eastern Gulf of Mexico (YT, TC and PI); dark gray = western Gulf of Mexico (TX); white = northern Yucatan (NY); vertical stripes = Belize City (BC); horizontal stripes = Dangriga (DG); crossed hatching = eastern Atlantic and Indo-Pacific; black = northern Brazil.

