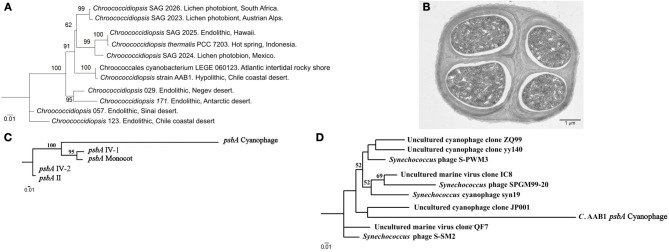
Figure 6.
16S rDNA Maximum Likelihood phylogenetic tree of select Chroococcidiopsis 16S rDNA sequences. (A) 16S rDNA cyanobacterial sequences. Sequences were aligned by Multiple sequence comparison by log-expectation and then analyzed by the PhyML tool of Bosque Phylogenetic Analysis software (Ramírez-Flandes and Ulloa, 2008). Numbers close to the nodes represent 1000 replicate Bootstrap values. Only species shown in Figure 2 of Fewer et al. (2002) were considered for comparison purposes. (B) Transmission electron microscopy micrograph showing the typical ultrastructure of a tetrad of Chroococcidiopsis strain AAB1. (C) Maximum Likelihood phylogenetic trees of psbA sequences found in Chroococcidiopsis strain AAB1. (A) psbA sequences found in the genome of Chroococcidiopsis strain AAB1. (D) A tree showing how a Chroococcidiopsis strain AAB1 psbA sequence fits in relation with other psbA sequences found in marine cyanophages. psbA sequences for both trees were aligned by Multiple sequence comparison by log-expectation and then analyzed by the PhyML tool of Bosque Phylogenetic Analysis software. Numbers close to the nodes represent 1000 replicas Bootstrap values.

