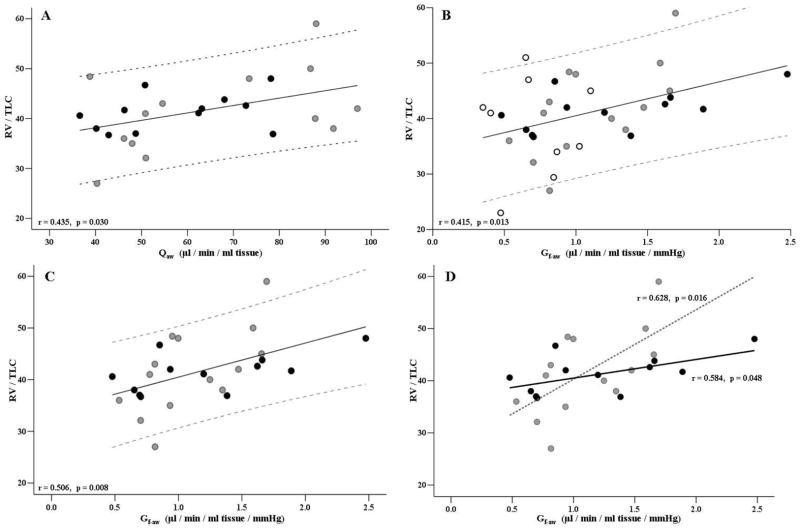
Figure 3.
Airway blood flow and bronchovascular conductance versus RV/TLC ratio. Q̇aw=Airway blood flow, Gf-aw=bronchovascular conductance flow, RV=residual volume (L), TLC=total lung capacity, HF = heart failure. White dots represent control group (CTRL), grey dots represent patients with HF-A (HF-A group, NYHA class I-II), and black dots represent (HF-B group, NYHA class III–IV). (A) Plot and regression for Q̇aw versus RV/TLC for all HF subjects. (B) Plot and regression for Gf-aw versus RV/TLC for all subjects. (C) Plot and regression for Gf-aw versus RV/TLC for all HF patients. (D) Plot and regression for HF-A group (dotted line) and for HF-B group (solid line)

