
Figure 3.
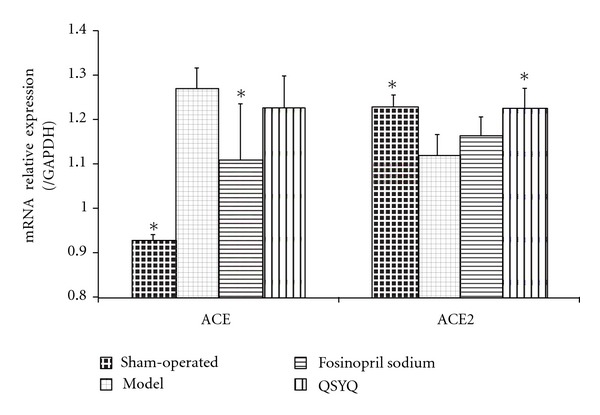
Cardiac ACE and ACE2 mRNA expression in rats. The relative levels of cardiac ACE and ACE2 mRNA were assessed by qPCR. Results were normalized to GAPDH. All values are means ± SD (n = 8). *P < 0.05 compared with model group.
Official websites use .gov
A
.gov website belongs to an official
government organization in the United States.
Secure .gov websites use HTTPS
A lock (
) or https:// means you've safely
connected to the .gov website. Share sensitive
information only on official, secure websites.
Cardiac ACE and ACE2 mRNA expression in rats. The relative levels of cardiac ACE and ACE2 mRNA were assessed by qPCR. Results were normalized to GAPDH. All values are means ± SD (n = 8). *P < 0.05 compared with model group.