Figure 6.
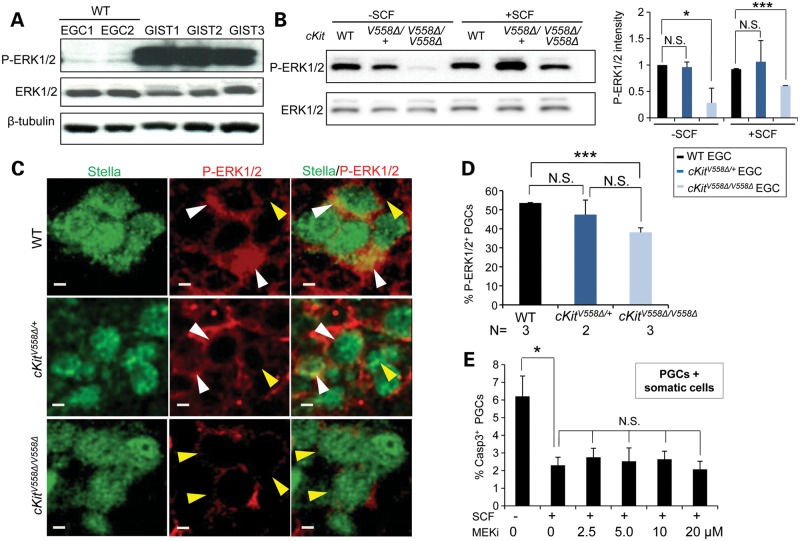
Hypophosphorylation of ERK1/2 in cKitV558Δ/V558Δ PGCs and EGCs. (A) GISTs (from three cKitV558Δ/+ mice) and cell lysates isolated from sorted EGCs (WT, two lines) were immunoblotted for P-ERK1/2, total ERK1/2 and β-tubulin, revealing high levels of activated ERK in GISTs. (B) EGCs sorted from STO cells were starved for 2 h and then treated with 50 ng/ml SCF for 10 min. Immunoblotting revealed a decrease in ERK1/2 phosphorylation in cKitV558Δ/V558Δ. The P-ERK1/2 levels shown on the graphs have been normalized to total ERK1/2. (C) WT, cKitV558Δ/+ and cKitV558Δ/V558Δ embryos at E11.5 were sectioned and co-immunostained for P-ERK1/2 and Stella, a PGC marker. P-ERK1/2 (red), mainly detected in cytoplasm and occasionally in the nucleus, was strong (white arrow heads) in WT and heterozygous PGCs, whereas it was weak or absent (yellow arrow heads) in cKitV558Δ/V558Δ PGCs. Frequencies of P-ERK1/2-positive PGCs (exhibiting strong staining) were quantified (D). (E) PGC from E11.5 WT embryos were co-cultured with somatic gonad cells in DMEM with 50 ng/ml SCF and an MEK inhibitor, PD032590, at the indicated concentrations for 20 h. The frequency of apoptotic PGCs, detected by caspase-3 and SSEA1 co-immunostaining, did not increase with MEK inhibitor treatment. Scale bars = 5 µm. *P < 0.05, ***P < 0.001.

