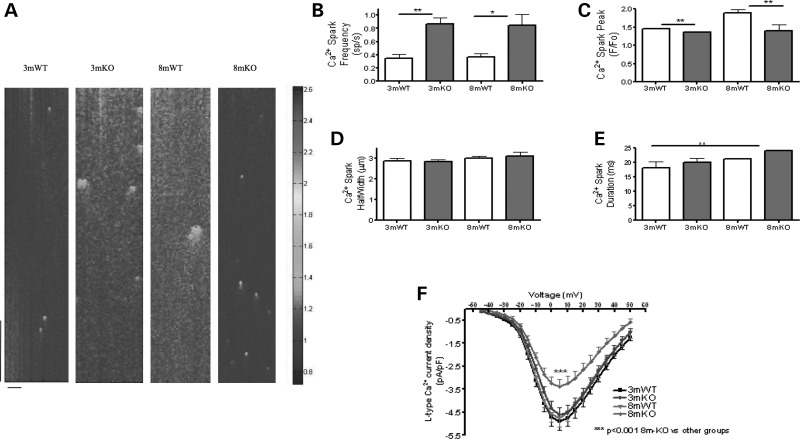
Figure 2.
Tcap KO is associated with progressive Ca2+ spark and LTCC defects. (A) The figure shows line scans of quiescent ventricular cardiomyocytes from 3 month or 8 month WT and Tcap KO hearts. The colour chart is a normalized scale of fluorescence intensity (a marker of Ca2+ concentration). 3mWT n = 40, 3mKO n = 48, 8mWT n = 48, 8mKO n = 43. The vertical scale bar represents 768 ms and the horizontal scale bar represents 100 pixels. Ca2+ spark frequency was increased (B) and Ca2+ spark peak was reduced (C) at 3 and 8 months in the KO. Ca2+ spark width (D) and duration (E) were not significantly changed. (F) The L-type Ca2+ channel current density is reduced in 8mKO. 3mWT n = 24, 3mKO n = 25, 8mWT n = 16, 8mKO n = 20.

