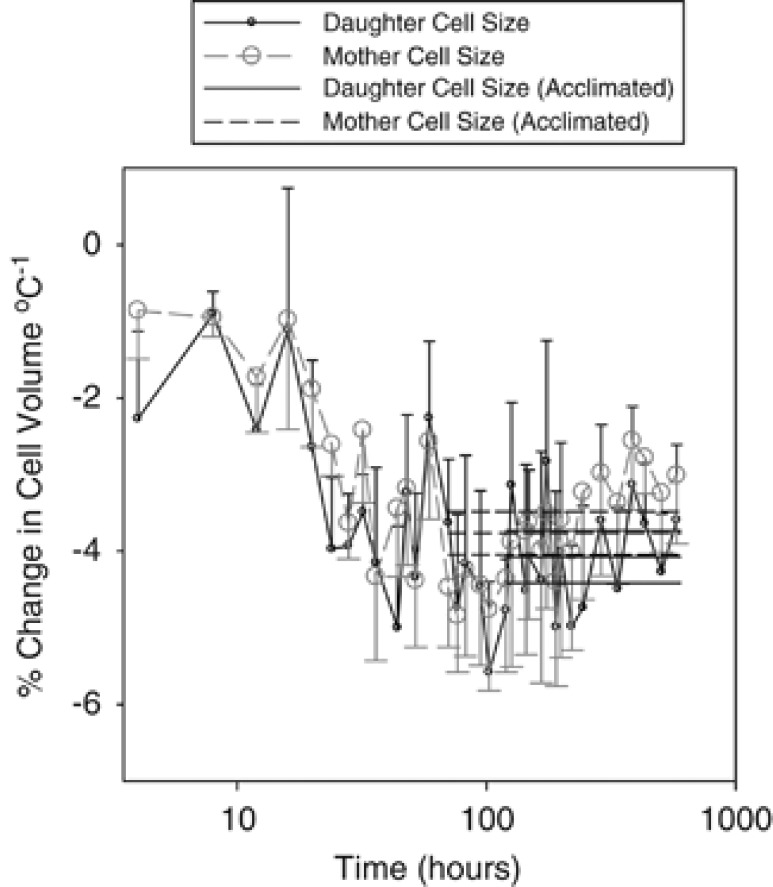
Figure 4.
Cyclidium glaucoma slopes of mother and daughter cell volumes vs temperature plotted against time. Mother cell volumes were calculated from the mean of the largest 20% of cells in a sample (n=2 × 3), daughter volumes were calculated from the smallest 20% of cells in a sample (n=2 × 3). Slopes were calculated as % changes in size per °C from that at 15 °C, using linear regression of cell volumes vs temperature at each time interval. Thick horizontal lines are mean % size changes for time periods where confidence intervals overlap for daughter (solid line) and mother (dashed line) data. Thinner lines either side =95% confidence intervals.

