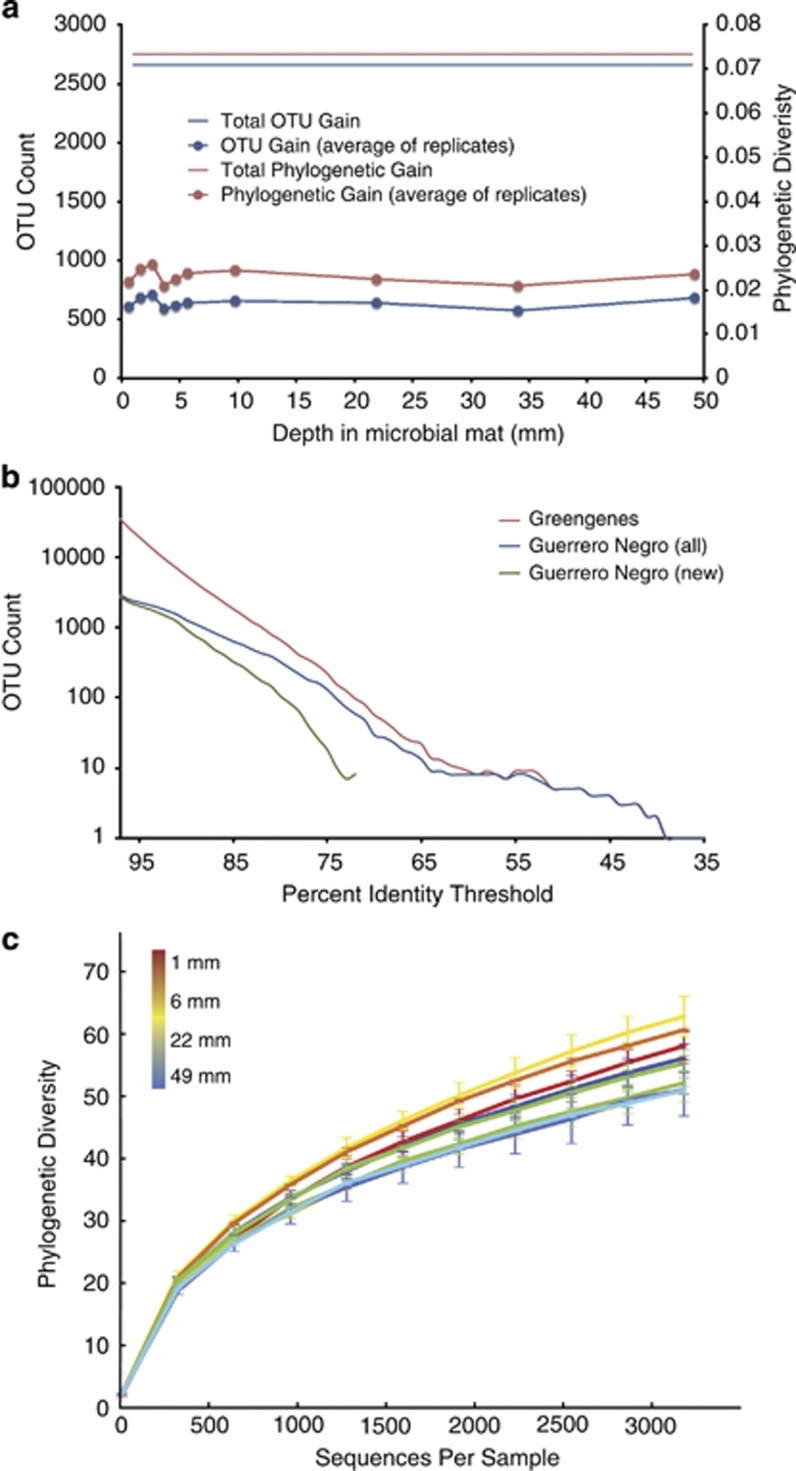
Figure 4.
(a) Phylogenetic gain (new phylogenetic tree branch length, right axis) and OTU gain (left axis) by layer in the GN mat for Sanger reads with respect to the Greengenes database. (b) OTU counts from 97% identity to 35% identity for Sanger sequences. The red line shows the number of OTUs in Greengenes at a given OTU identity threshold; the blue line shows the number of OTUs in the GN data set at a given OTU identity threshold; and the green line shows the number of OTUs in the GN but not Greengenes data base, that is, the number of novel OTUs in the GN data set, at a given identity threshold. The y axis is log scale, so lines are not present when y=0. (c) Alpha rarefaction plots for Sanger reads. Plots are color-coded by depth in the mat according to the inset: red indicates top layers, yellow and green indicate middle layers and blue indicates bottom layers.

