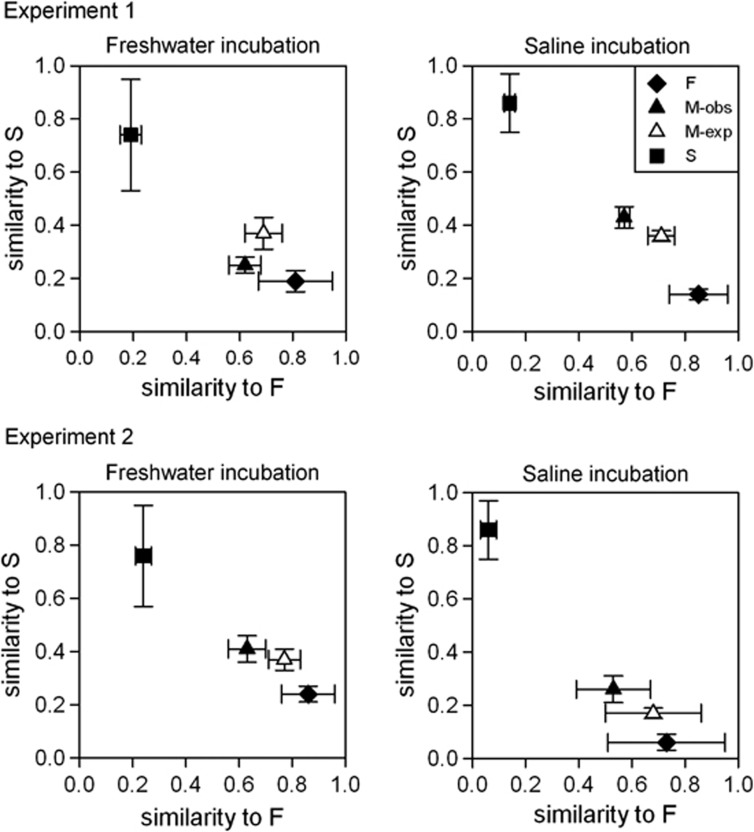
Figure 6.
Comparison of bacterial community composition based on Bray–Curtis similarities. Mean values of the Bray–Curtis similarities to the mean unmixed freshwater and saline samples are plotted under freshwater and saline conditions in experiment 1 and in experiment 2. ‘F' stands for freshwater source of the sample, ‘S' for saline, ‘M-obs' for observed mixed communities and ‘M-exp' for composition expected for mixed communities based on the unmixed samples; ‘f' and ‘s' stand for incubation environment in experiment 1 and experiment 2, respectively. Error bars indicate s.d. Along the horizontal axes, similarity to freshwater samples (F) is shown, whereas the vertical axes indicate similarity to saline samples (S). Deviation from one in case of the similarity of the unmixed samples (F and S) to their corresponding axes is due to the differences among replicates.

