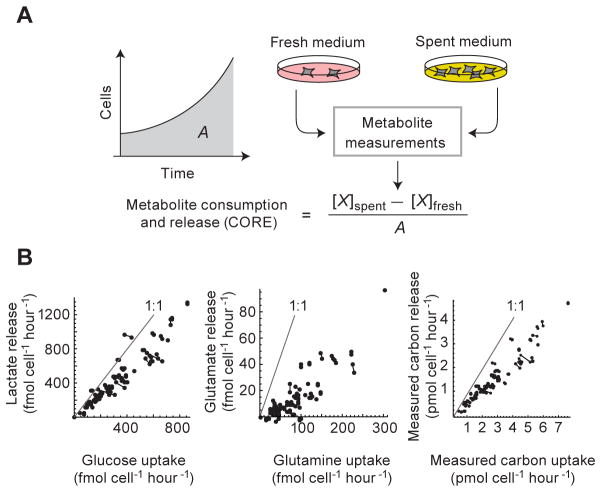
Figure 1. Metabolite consumption and release (CORE) profiling.
A: For determining metabolite CORE (consumption and release rate) profiles, medium samples taken before (fresh) and after (spent) 4–5 days of cell culture are subjected to metabolite profiling using LC-MS/MS. For each metabolite X, the CORE value is calculated as the difference in molar abundance normalized to the area A under the growth curve. B: Glucose consumption vs. lactate release; glutamine consumption vs. glutamate release; and total measured carbon consumption vs. total measured carbon release, across the 60 cell lines. Gray lines indicate the 1:1 molar ratio of carbon consumed: carbon released for each metabolite pair; joined data points represent biological replicates.

