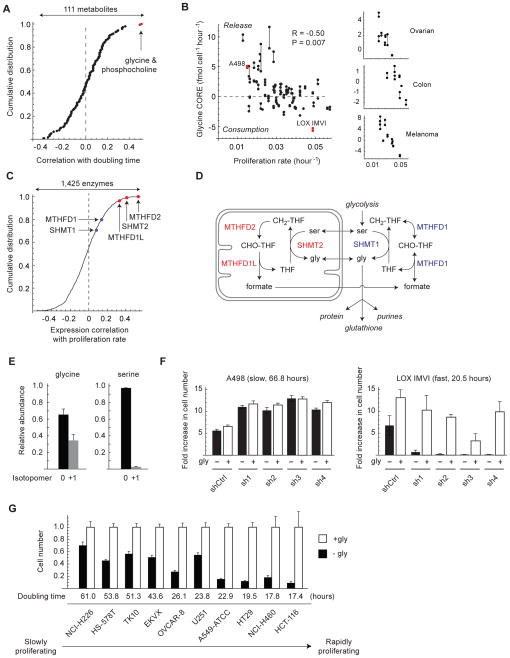
Figure 3. Glycine consumption and synthesis are correlated with rapid cancer cell proliferation.
A: Distribution of Spearman correlations between 111 metabolite CORE profiles and proliferation rate across 60 cancer cell lines. Metabolites highlighted in red are significant at P < 0.05, Bonferroni-corrected. B: Glycine CORE versus proliferation rate across 60 cancer cell lines (left) and selected solid tumor types (right). Cell lines selected for follow-up experiments are highlighted in red. Joined data points represent replicate cultures. P-value is Bonferroni-corrected for 111 tested metabolites. C: Distribution of Spearman correlations between gene expression of 1,425 metabolic enzymes and proliferation rates across 60 cancer cell lines. Highlighted are mitochondrial (red) and cytosolic (blue) glycine metabolism enzymes. D: Schematic of cytosolic and mitochondrial glycine metabolism. E: Abundance of unlabeled (0) and labeled (+1) intracellular glycine and serine in LOX IMVI cells grown on 100% extracellular 13C-glycine. F. Growth of LOX IMVI and A498 cells expressing shRNAs targeting SHMT2 (sh1-4) or control shRNA (shCtrl), normalized to shCtrl cells; gly, glycine. G. Growth of 10 cancer cell lines expressing shRNA targeting SHMT2 (sh4) after 3 days cultured the absence (−gly, filled bars) or presence (+gly, open bars) of glycine. Cell number is presented as a ratio relative to +gly cells. Error bars in E,F,G denote standard deviation.

