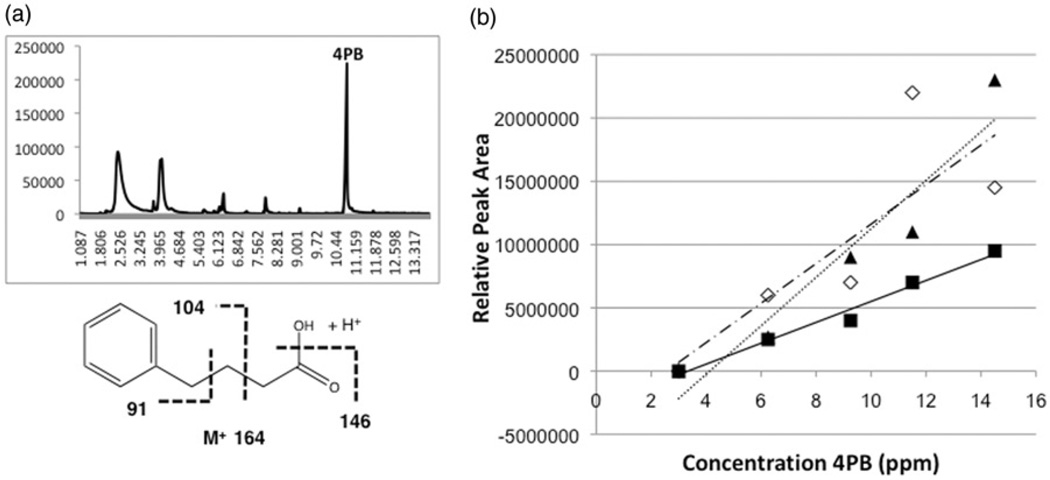
Figure 2.
Total ion chromatogram (top) showing peak (10.9 min), and mass spectrum and expected fragmentation pattern (bottom), of 4PB in Lemieux oxidation reactions sampled by SPME (a), as well as linearity of response for peak area versus 4-PB concentration for SPME fibres (▲/……: PDMS-DVB, ■/ —: DVB-CAR-PDMS and ◊/ – –: PA) evaluated in the study.

