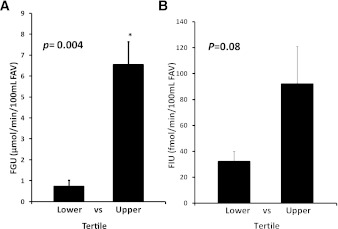
Figure 2.
A: The mean ± SEM of FGU observed in the five individuals who either had no increase in MBV or had an actual decline (lowest tertile) versus that in the five individuals who had the greatest percent increase in MBV (highest tertile). B: The mean ± SEM changes in FIU between baseline and the last 40 min of the insulin clamp in the same two groups. The P values were determined by unpaired t tests. FAV, forearm volume.

