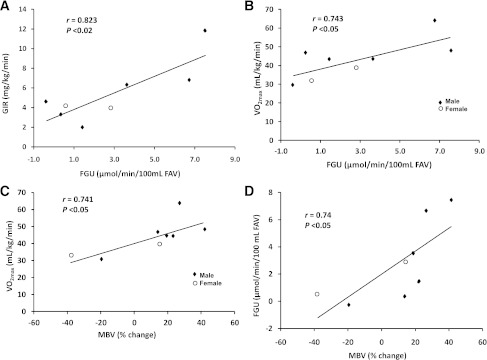
Figure 3.
A: The correlation between whole-body GIR and FGU, each measured during the last 40 min of the insulin clamp, in eight individuals in whom fitness was assessed by Vo2max. B: The correlation between the Vo2max and FGU in the same individuals. C: The correlation between Vo2max and the percentage change in MBV seen during the first 30 min of insulin infusion in the same individuals. D: The correlation between FGU measured during the last 40 min of the insulin clamp and the percentage change of MBV measured during the first 30 min of the insulin infusion in the same individuals. FAV, forearm volume.

