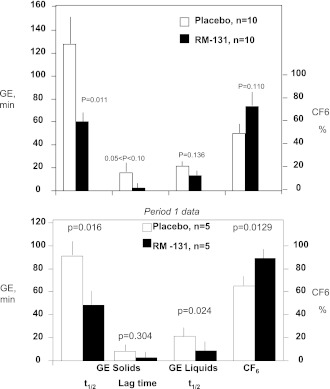
Figure 1.
Effect of RM-131 on main transit measurements (GE, minutes for solids and liquids, and CF6, percent). Top: Data in all 10 patients. Bottom: Analysis of data in period 1 only (n = 5 per group; see text for details). White bars, placebo; black bars, RM-131, 100 μg, treatment. Data are mean ± SEM. P values by the Student paired t test comparing RM-131 vs. placebo above each comparison (top) and by the Student unpaired t test comparing RM-131 vs. placebo (bottom). Published normal data (28) with this meal show t1/2 solid of median 83 min (IQR 64–103 min).

