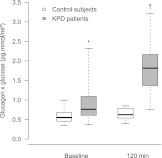
Figure 1.
Distribution of the product glucagon × glucose during OGTT at baseline and at 120 min in KPD patients (gray) and control subjects (white). The horizontal line in the middle of each box indicates the median; the top and bottom borders of the box represent the first and third quartiles of the distribution; and the whiskers represent 1.5 times the interquartile range. *P = 0.03; †P < 0.0001 vs. control subjects.

