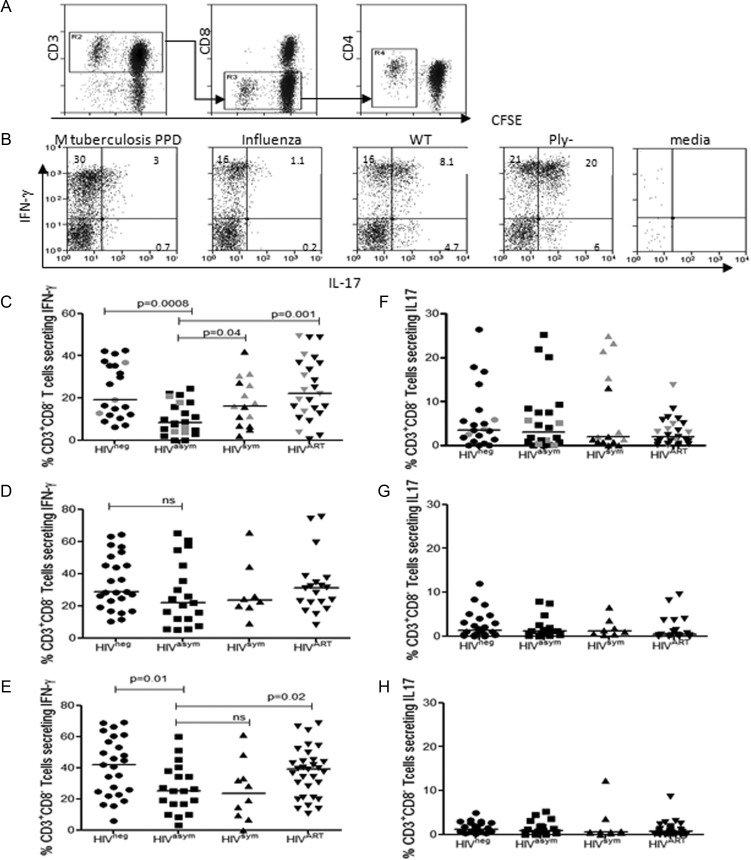
Figure 4.
Pneumococcal-specific Th1 and Th17 responses in peripheral blood during human immunodeficiency virus (HIV) infection. Representative flow cytometric data from a HIV-uninfected control demonstrating CD3+CD8– T-cell proliferation (A) and interferon gamma (IFN-γ) and interleukin 17 (IL-17) production (B) in response to Mycobacterium tuberculosis (MTB) purified protein derivative (PPD), influenza, wild-type (WT) cell culture supernatant (CCS), Ply− CCS, and media only. The percentage indicated in the upper-left quadrant represents the cell population that produced cytokines following 7-day expansion and restimulation with phorbol 12-myristate 13-acetate and ionomycin. Collated flow cytometric data demonstrating the proportion of CD3+CD8– T cells producing IFN-γ in response to WT CCS (C), M. tuberculosis PPD (D), and influenza (E) in HIV-uninfected (circles: WT n = 21, MTB n = 22, Flu n = 24), HIV-asymptomatic (squares: n = 19), HIV-symptomatic (triangles: WT n = 15, MTB n = 8, Flu n = 10), and all HIV-infected individuals established on antiretroviral therapy (ART) (6–24 months) (inverted triangles: WT n = 25, MTB n = 19, Flu n = 31). Proportion of CD3+CD8– T cells producing IL-17 in response to to WT CCS (F), M. tuberculosis PPD (G), and influenza (H) in HIV-uninfected, HIV-asymptomatic, HIV-symptomatic, and all HIV-infected individuals established on ART (6–24 months). Gray data points represent individuals who were positive for pneumococcal nasopharyngeal carriage. Black horizontal bars represent median values of total antigen-specific responses above background. Statistical significance was analyzed by the Mann-Whitney U test. Differences were considered significant if P ≤ .05.

