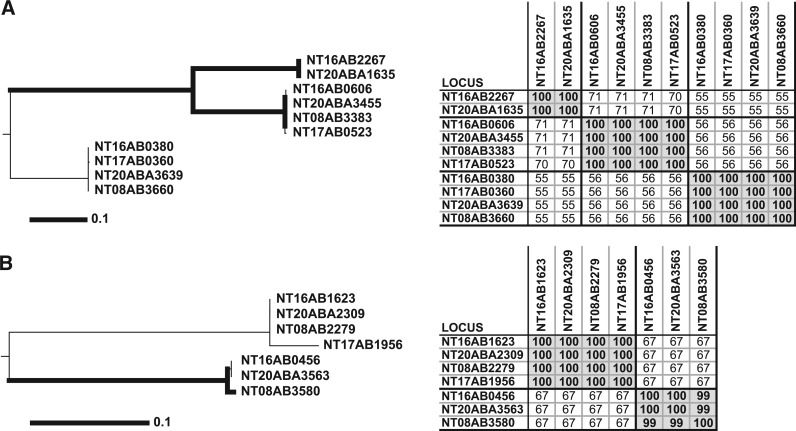
Figure 5.
Separation of divergent paralogs into orthologous clusters. The left panels denote consensus Neighbor-joining trees from 100 bootstrap replicates as previously described (26). The thick lines infer the strength of bootstrap values >74. The scale bar represents the number of amino acid substitutions. The panels on the right show tables of pairwise BLAST protein percent identities. OrthoMCL (A) and InParanoid (B) grouped every protein depicted into two large clusters (one in A and another in B), while the other three methods produced clusters identical with the phylogenetic trees (three in A and two in B). Protein percent identity was sufficient to group these proteins into unambiguous clusters (tables on right).

