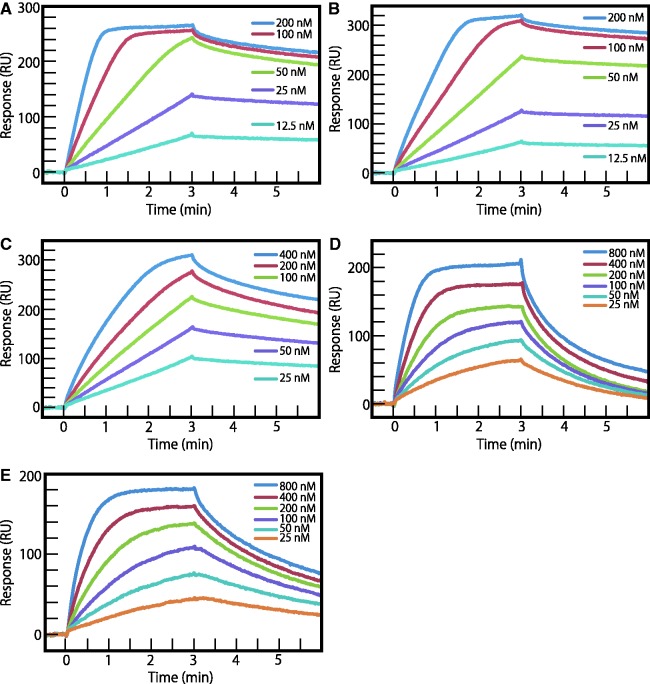
Figure 3.
SPR sensorgrams for the interaction of Py–Im polyamides with hairpin DNAs immobilized on a sensor chip SA. (A) Py–Im polyamide 1 with ODN1 at a concentration range from 1.25 × 10⁻⁸ (lowest curve) to 2.0 × 10⁻⁷ M (highest curve). (B) Py–Im polyamide 2 with ODN2 at a concentration range from 1.25 × 10⁻⁸ (lowest curve) to 2.0 × 10⁻⁷ M (highest curve). (C) Py–Im polyamide 3 with ODN3 at a concentration range from 2.5 × 10⁻⁸ (lowest curve) to 4.0 × 10⁻⁷ M (highest curve). (D) Py–Im polyamide 4 with ODN4 at a concentration range from 2.5 × 10⁻⁸ (lowest curve) to 8.0 × 10⁻⁷ M (highest curve). (E) Py–Im polyamide 5 with ODN5 at a concentration range from 2.5 × 10⁻⁸ (lowest curve) to 8.0 × 10⁻⁷ M (highest curve).

