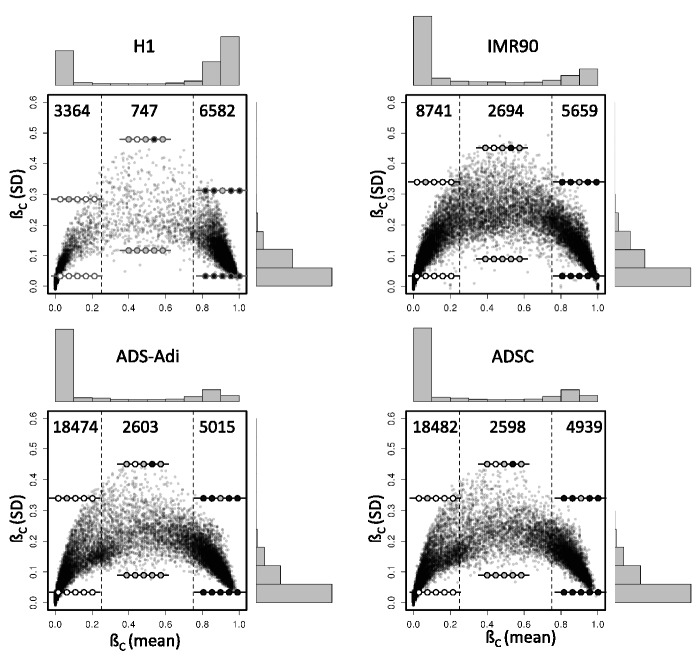
Figure 1.
Homogeneity of CpG methylation in CpG islands. The mean of all informative CpG sites located inside each CpG island (CpG island methylation coefficient, ßC) is plotted against the SD for four of the cell lines analysed in this study. Vertical dash lines delimit graph areas containing unmethylated (ßC mean <0.25) and methylated (ßC mean >0.75) CpG islands. The numbers of points represented in each area of the graph and the distribution histograms of both axes are shown. Illustrative DNA methylation profiles of CpG islands represented in each area are displayed using lollipop diagrams, in which empty dots represent unmethylated CpG sites, whereas gray-filled dots represent partially methylated sites and black-filled dots fully methylated sites. Only CpG islands with high coverage are displayed.

