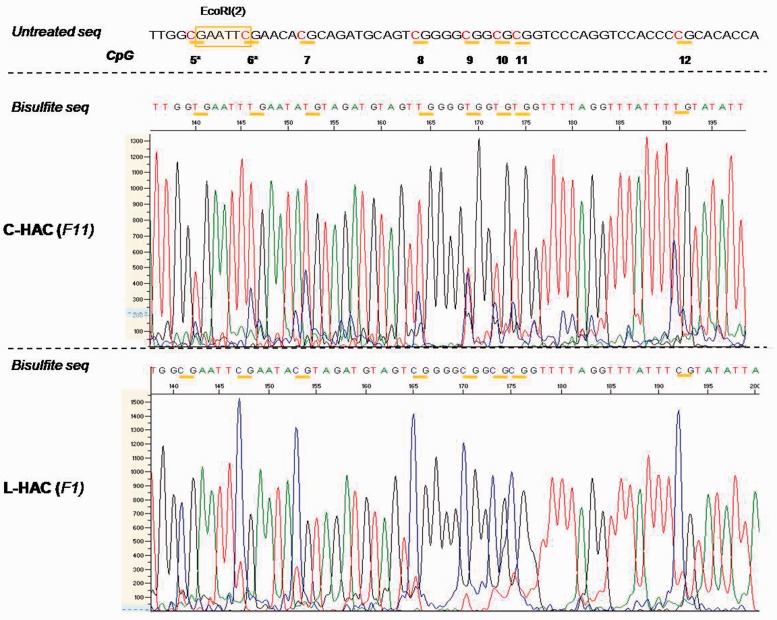
Figure 8.
In vivo bisulfite sequencing data for the C- and L-HAC. Analogous to the in vitro analysis, a region of 60 bp surrounding EcoRI(2) was analysed. All the CpGs are marked by horizontal yellow bars. They are termed 5–12 and correspond to CpGs 5–12 in Figure 5. All C nucleotides that precede a G nucleotide are highlighted in red. Genomic DNA of the mice containing the C-HAC was extracted from mouse tail fibroblast derived from mice backcrossed to the NMRI background for 11 generations. For the L-HAC, solely mice from generation 1 (F1) were available. The graphs represent screenshots from the chromatogram obtained from the 3130x Genetic Analyzer (Life Technologies). The scale on the left (0–1300 and 0–1500) reflects the peak intensity for each nucleotide readout. The CpG′s in the subtelomeric region of the L-HAC are clearly hypermethylated compared to their counterparts on the circular chromosome. Untreated seq: the untreated wild-type sequence at that specific locus; bisulfite seq: the sequence that was obtained upon bisulfite treatment and sequencing PCR; F11: the 11th generation of offspring; F1: the 1st generation of offspring.

