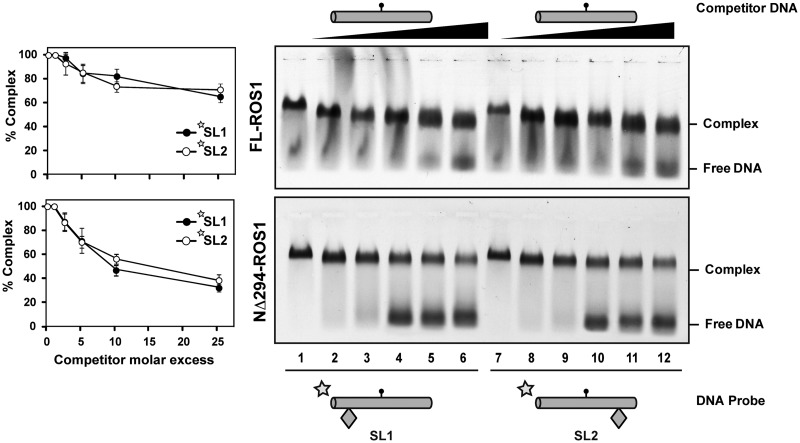
Figure 3.
ROS1 slides DNA randomly. Gel shift assay showing dissociation of FL-ROS1 (upper panel, 120 nM) and NΔ294-ROS1 (lower panel, 200 nM) from fluorescein-labelled substrates SL1 (lanes 2–7, 100 nM) and SL2 (lanes 8–13, 100 nM) containing a single 5-meC:G pair on addition of increasing amounts (0, 0.1, 0.25, 0.5, 1.0 and 2.5 μM) of methylated unlabelled competitor S. After non-denaturing gel electrophoresis, the gel was scanned to detect fluorescein-labelled DNA. Protein-DNA complexes were identified by their retarded mobility compared with that of free DNA, as indicated. Graphs on the left show the percentage of remaining complex versus competitor molar excess ratios. Values are mean ± SE from two independent experiments, adjusted with the unbiased estimator described in (36).

