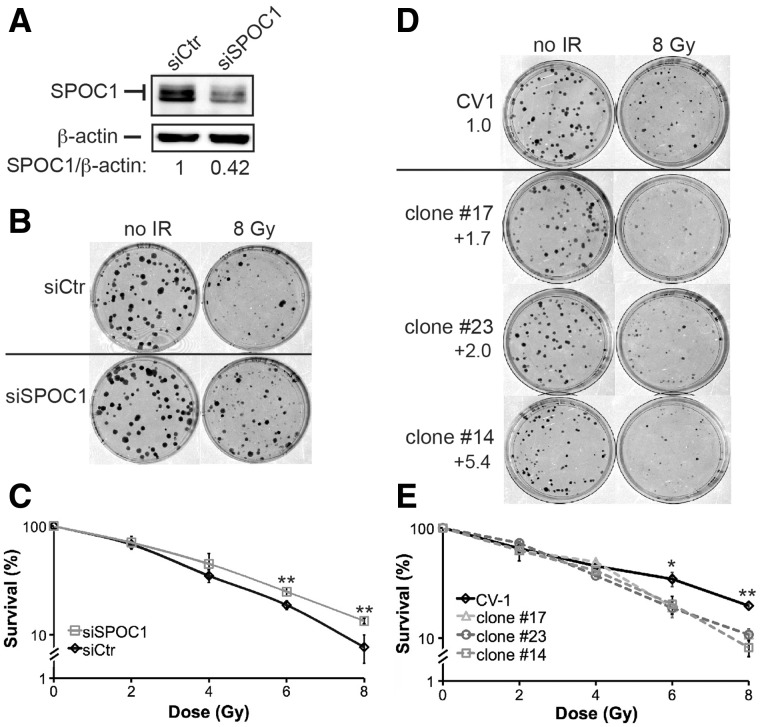
Figure 5.
SPOC1 protein expression levels affect cell survival after γ-IR. (A) Immunoblot analysis shows that SPOC1 levels in SPOC1 siRNA transfected CV1 cells are reduced by 58% compared to control siRNA-transfected cells as analyzed by densitometry. These cells were used for clonogenic survival assays (see below). (B) Colony formation assays: SPOC1-siRNA treated cells formed more colonies than control siRNA transfected cells when analyzed after 8 Gy γ-IR and 9 days post-plating, indicating higher radioresistence. (C) Survival curves based on clonogenic growth of CV1 cells transfected with SPOC1-siRNA or control siRNA, analyzed after 0–8 Gy γ-IR and up to 9 days after plating. SPOC1 knockdown results in increased radioresistance. (D) Colony formation assays: different SPOC1 overexpressing (1.7- to 5.4-fold) cell lines formed less colonies than control cells when analyzed after 8 Gy γ-IR and 12 days post-plating, indicating higher radiosensitivity. (E) Survival curves based on clonogenic growth of SPOC1 overexpressing (1.7- to 5.4-fold) or control cells after 0–8 Gy γ-IR and analyzed 12 days after plating. SPOC1 overexpression results in lower radioresistance. Cells were plated in two different densities and in triplicates. Mean values ± SD are given. *P ≤ 0.05; **P ≤ 0.01.

