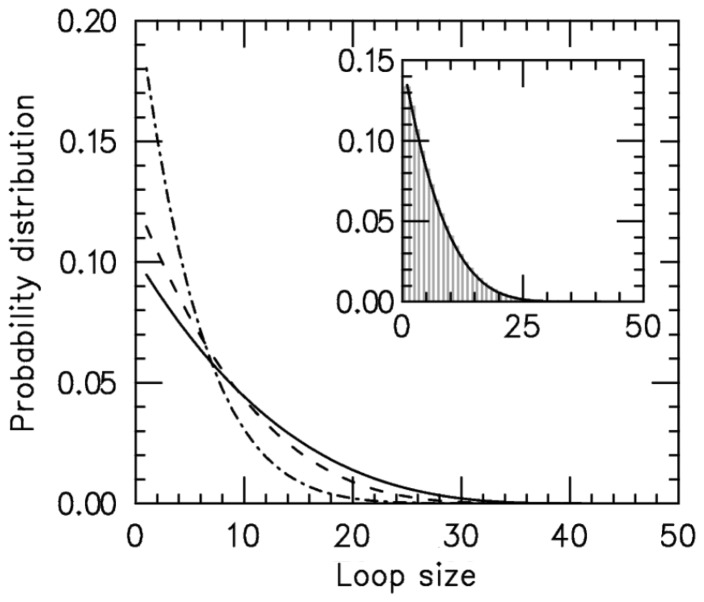
Figure 2.
Loop-size distribution for M = 5 pairs of non-disassociating loop-extruding machines on a lattice of size L = 50. The probability distribution broadens as the bias ( ) increases. Main figure shows results for
  1.05 (dot-dashed line), 1.5 (dashed line) and 4.0 (solid line). Inset: comparison of steady-state loop-size distributions for exact statistical theory (solid black line) and kinetic simulation
  (gray bars); difference between them is negligibly small. The simulation was run
  times, each for a time of
  Standard errors for the histogram bars have a maximum value of
  and are invisible on this plot.

