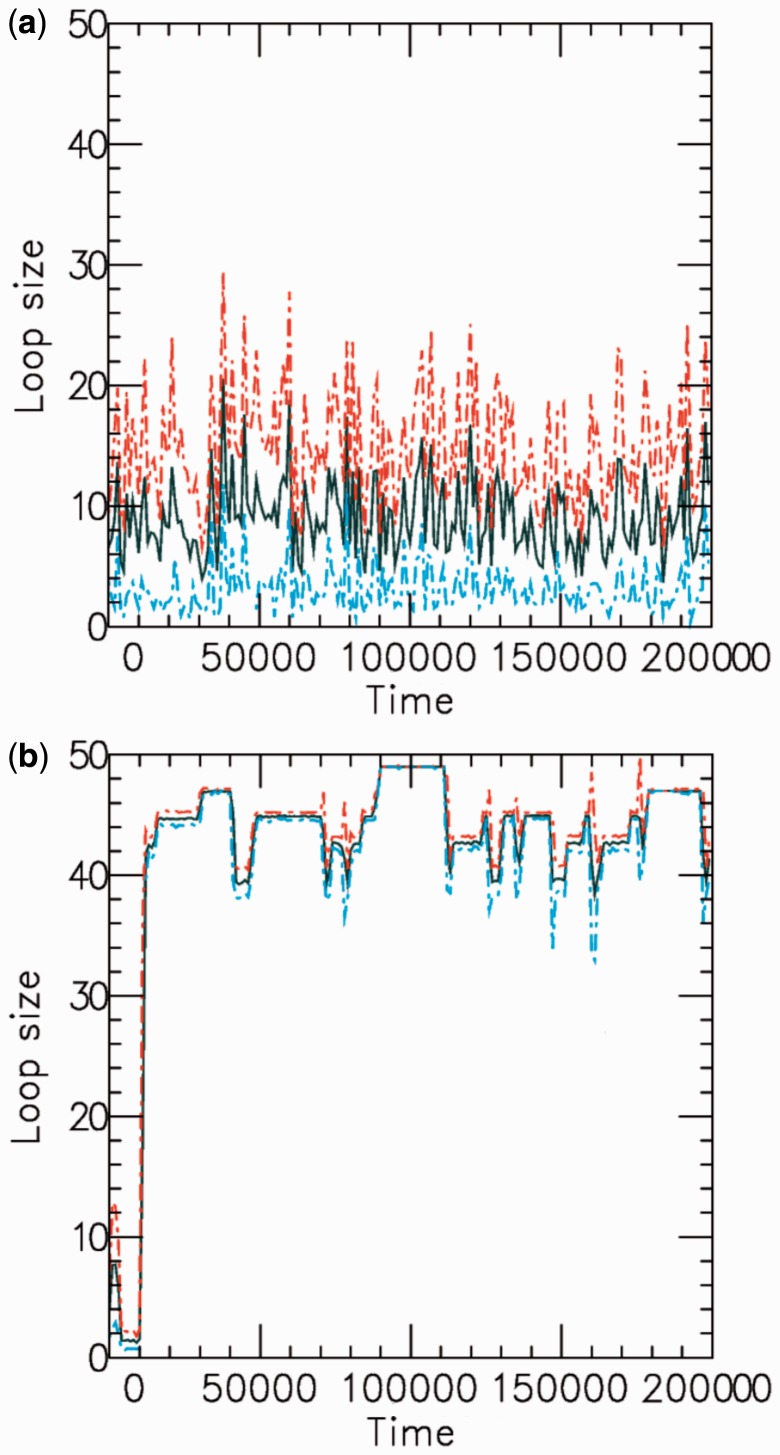
Figure 3.
Example time series of loop size for  for a (a) non-disassociating and a (b) dissociating case (
 ), for M = 5 machines on a substrate of length L = 50. The dark solid line shows the average of the sizes of the M loops, and the red and blue dashed lines indicate the width (one standard deviation) of the distribution of loop sizes subtended by the machines as a function of time. As in all cases mentioned in this article, time is in units of
  .
.

