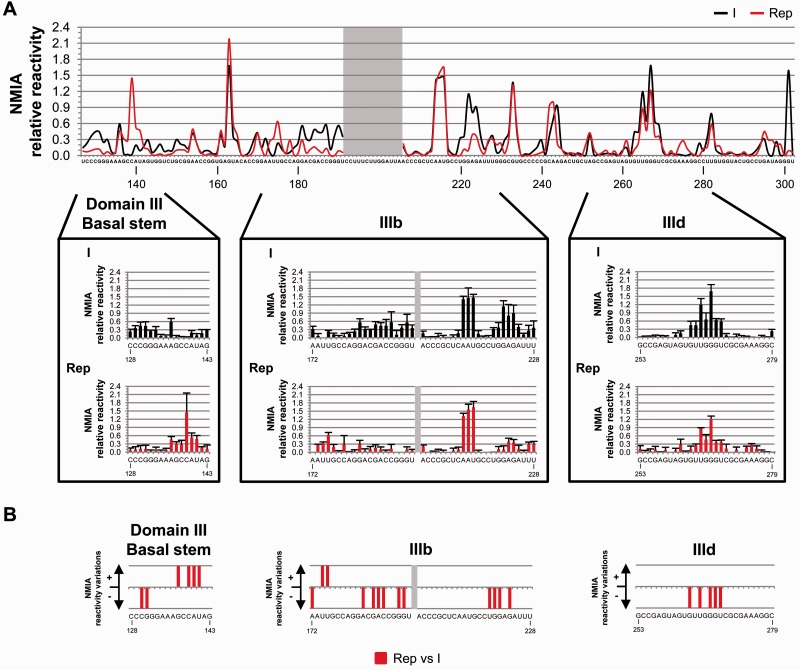
Figure 7.
SHAPE analysis of domain III of the HCV IRES within a replication-competent transcript. (A) Comparative study of the mean NMIA reactivity values obtained from at least five independent experiments for RNA molecules I (black) and Rep (red). Mean values of <0.3 correspond to non-reactive positions. The gray box shows noisy residues. Lower panel: detailed views of the SHAPE reactivity profile for selected regions within domain III. Histograms of SHAPE data represent the mean NMIA relative reactivity value ± SD. (B) Significant variations (P ≤ 0.05) in the SHAPE pattern for the replicative RNA molecule Rep with respect to transcript I. A qualitative representation of the gain (+) or loss (−) in SHAPE reactivity at subdomains IIIb, IIId and the basal stem of domain III is shown. Nucleotide numbering is specified as described in Figure 1A.

