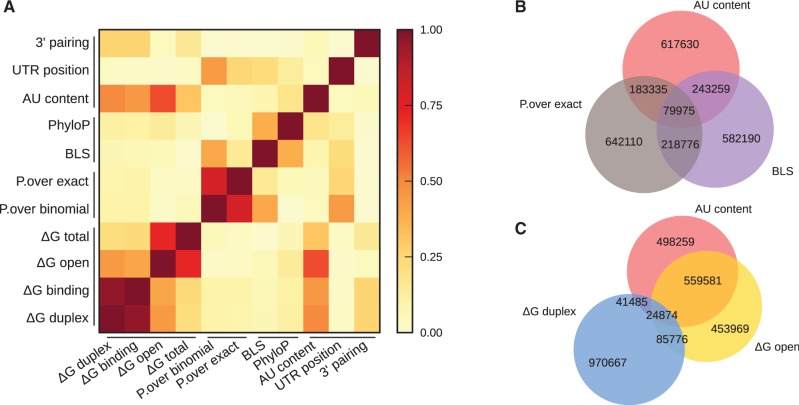
Figure 2.
Correlation among features based on prediction for human miRNAs and mRNAs. (A) A heatmap of the absolute values of Spearman correlation coefficients between pairs of features classified in methods categories. Venn diagrams (B) and (C) show the overlaps among the first best prediction quartiles of selected features. One feature per category (sequence-based with ‘AU content’, conservation with the ‘BLS’ and probabilistic with ‘P.over exact’) is shown on (A). Venn diagram (C) underlines the high overlap between ‘AU content’ and ‘ΔG open’ that we grouped in the ‘accessibility group’, whereas ‘ΔG duplex’ has a very low overlap with these two features. We grouped ‘ΔG duplex’ with ‘ΔG binding’ in the ‘binding energy’ group. Numbers of predicted relationships between human miRNA and mRNA are written in the corresponding overlaps of the Venn diagrams.

