
Figure 5.
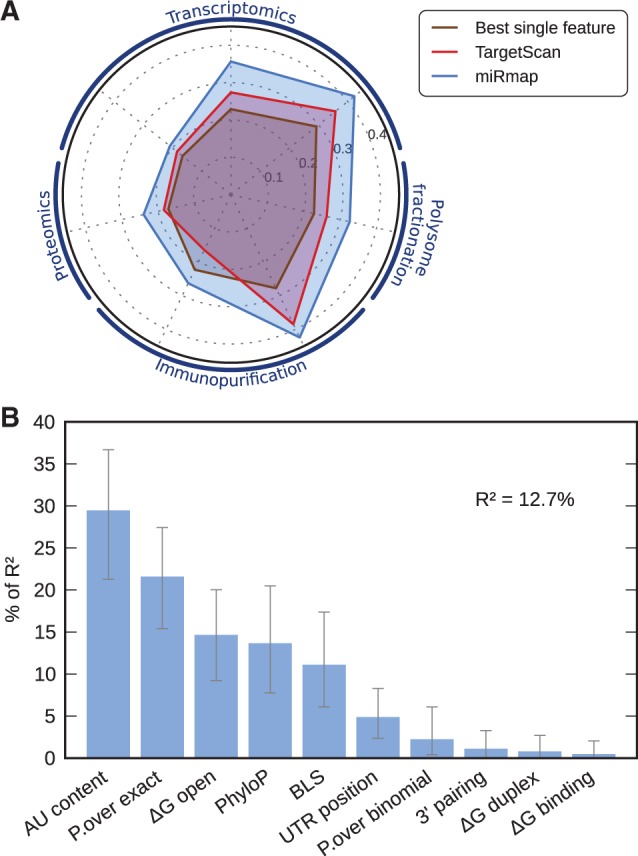
(A) Performance comparison (as coefficient correlations with experimental miRNA repression measures; order of the experiments is the same as Figure 4) of the best performing feature (brown), TargetScan context score (red) and miRmap (blue). (B) Feature relative importance in the miRmap multiple linear regression model predicting miRNA repression strength. R2 is the proportion of variance explained by the model. ‘AU content’ is the most explanatory variable with 29% of R2.