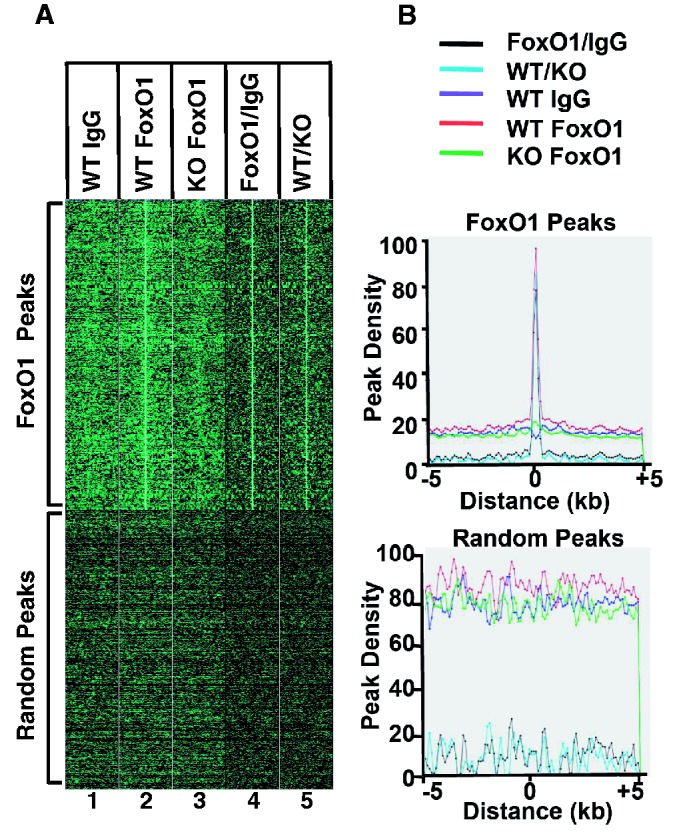
Figure 3.

Density map plots of FoxO1 ChIP-seq peaks. (A) The top panel represents the read distribution of peaks in ChIP-seq for FoxO1, whereas the bottom panel represents the read distribution of random peaks. (B) The top and the bottom plots represent cumulative reads of FoxO1 ChIP-seq peaks and those of random peaks, respectively. The maximum number of read is set to 100.
