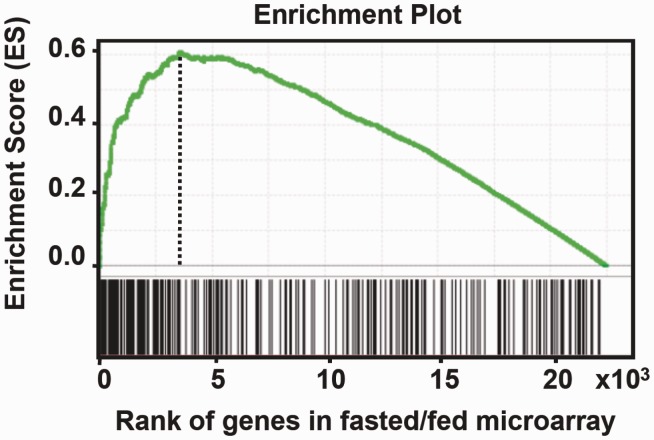
Figure 5.
Gene set enrichment analysis. All genes (n = ∼2.5 × 10⁴) in microarray expression profiling from fed versus fasted mouse livers were ranked by fold difference and P-value and expressed on the x-axis. This data set was compared with the gene list of nearest genes (n = 296) identified in ChIP-seq peaks located within 20 kb of a known gene. The plot of running sum for genes in ChIP-seq data is shown at the bottom with the leading-edge subset. The location of maximum enrichment score indicates a high correlation of the two data sets.

