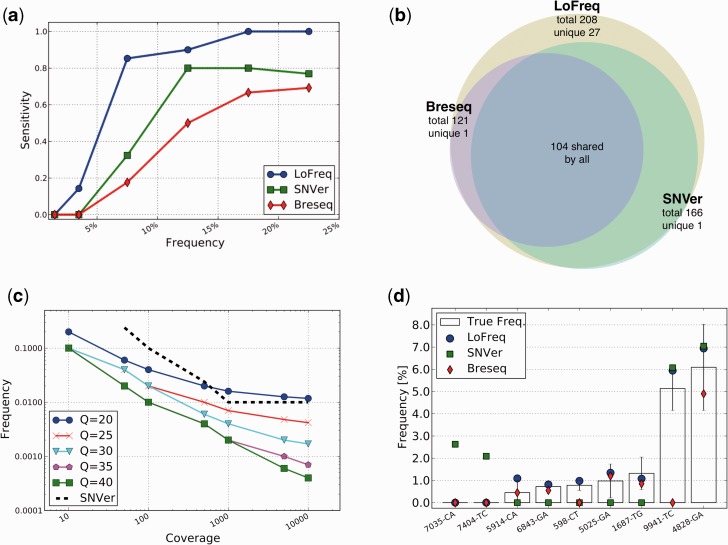
Figure 1.
In silico and experimental validation. (a) Sensitivity as a function of SNV frequency for LoFreq, SNVer and Breseq on a simulated viral population (see ‘Materials and Methods’ section). (b) Venn diagram showing the overlap of SNV predictions on the simulated population. (c) Detection limits for LoFreq and SNVer as a function of sequencing quality and coverage. Note that SNVer results are unaffected by varying quality values. (d) Validation results for rare variants on a Fluidigm Digital Array. Standard deviations are shown as boxes with error-bars. Note that three assays failed (reporting a non-sense frequency of 50%) and are not shown here.

