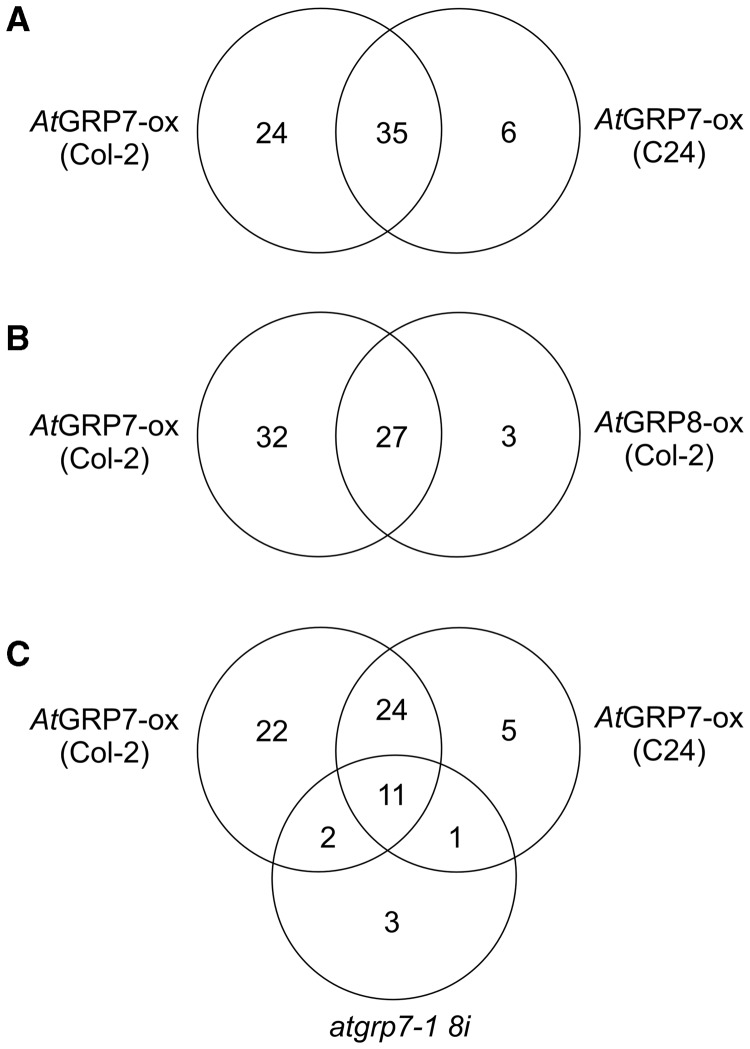
Figure 1.
Changes in the ratio of AS isoforms in AtGRP7-ox, AtGRP8-ox and atgrp7-1 8i. (A) Venn diagram showing the number of splicing events with significant changes in AtGRP7-ox (Col-2) and AtGRP7-ox (C24) when compared to the Col-2 and C24 wild-types, respectively. (B) Venn diagram showing the number of splicing events with significant changes in AtGRP7-ox (Col-2) and AtGRP8-ox (Col-2). (C) Venn diagram showing the number of splicing events with significant changes in AtGRP7-ox (Col-2 and C24) and atgrp7-1 8i. The numbers represent transcripts with significant changes in the ratio of AS isoforms (>5% and P < 0.05).

