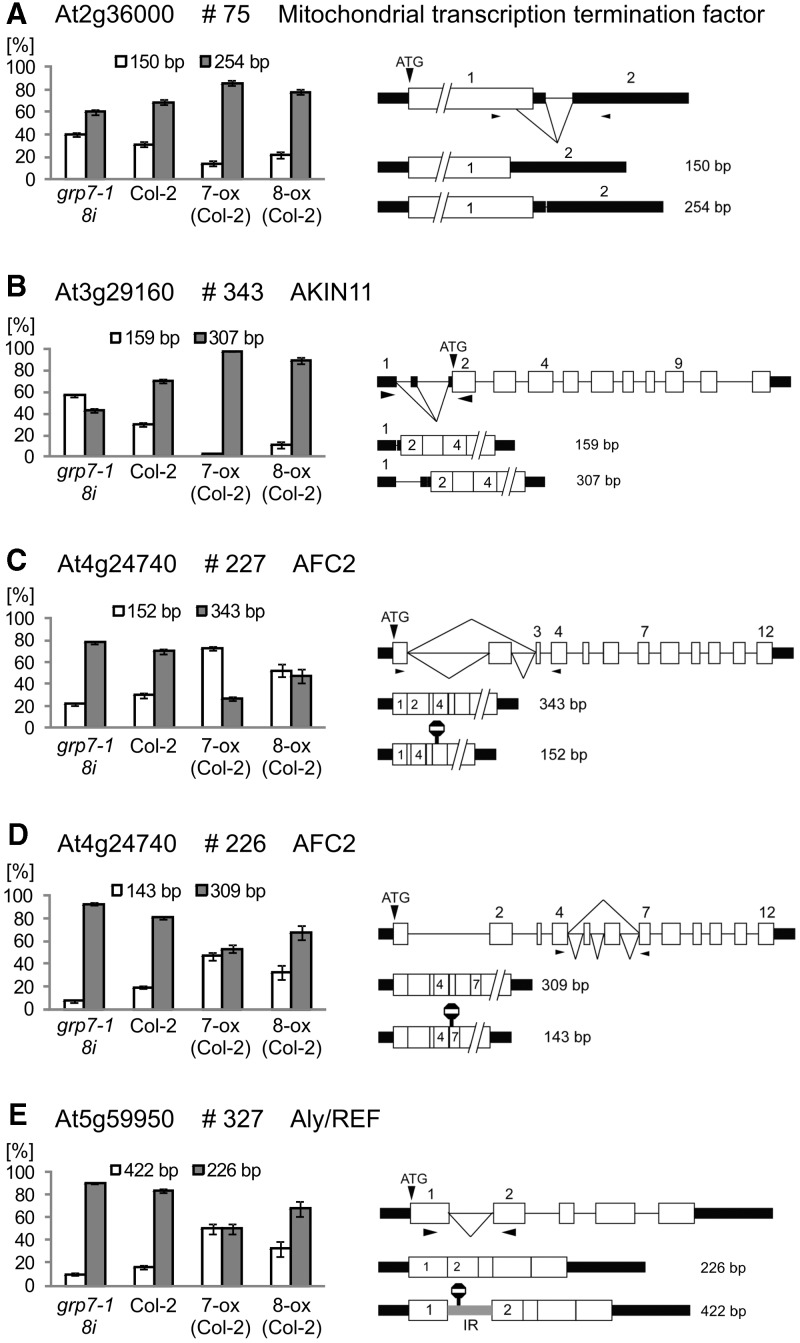
Figure 2.
Genes/transcripts with significant changes in the AS patterns in opposite directions in atgrp7-1 8i and AtGRP7-ox plants. (A) At2g3600 (#75) Mitochondrial transcription termination factor, (B) At3g29160 (#343) AKIN11, (C) At4g24740 (#227) AFC2, (D) At4g24740 (#226) AFC2 and (E) At5g59950 (#327) Aly/REF-like protein. On the left side of each panel, the percentage of each splice form ± SD based on three biological replicates is indicated for atgrp7-1 8i, wt, and AtGRP7-ox plants, respectively. For comparison, the data for AtGRP8-ox plants are included. On the right side of each panel, the gene and transcript structures and the AS events are shown schematically. Exons are indicated by open boxes and numbered, UTRs—black rectangles, introns—thin lines, splicing events—diagonal lines and stop signs—PTCs. The sizes of the PCR products from each splice isoform are indicated.

