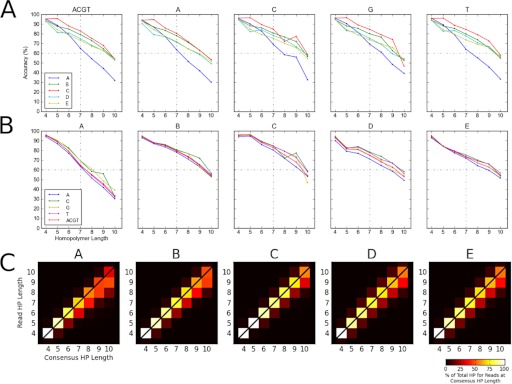
FIGURE 5.

Aspects of homopolymer accuracy. (A) Trend of facility homopolymer accuracy/nucleotide. The left-most plot is overall homopolymer accuracy/facility (identical to Fig. 4B), with subsequent plots depicting accuracy for each nucleotide separately. (B) Trend of homopolymer accuracy/facility. Each chart depicts overall accuracy/facility, and each plot line depicts accuracy for each nucleotide. (C) Homopolymer over-call and under-call rates. The chart depicts for each facility the percent agreement (diagonal), under-call (below diagonal), and over-call (above diagonal) of homopolymers from read sequences to the genome sequence.
