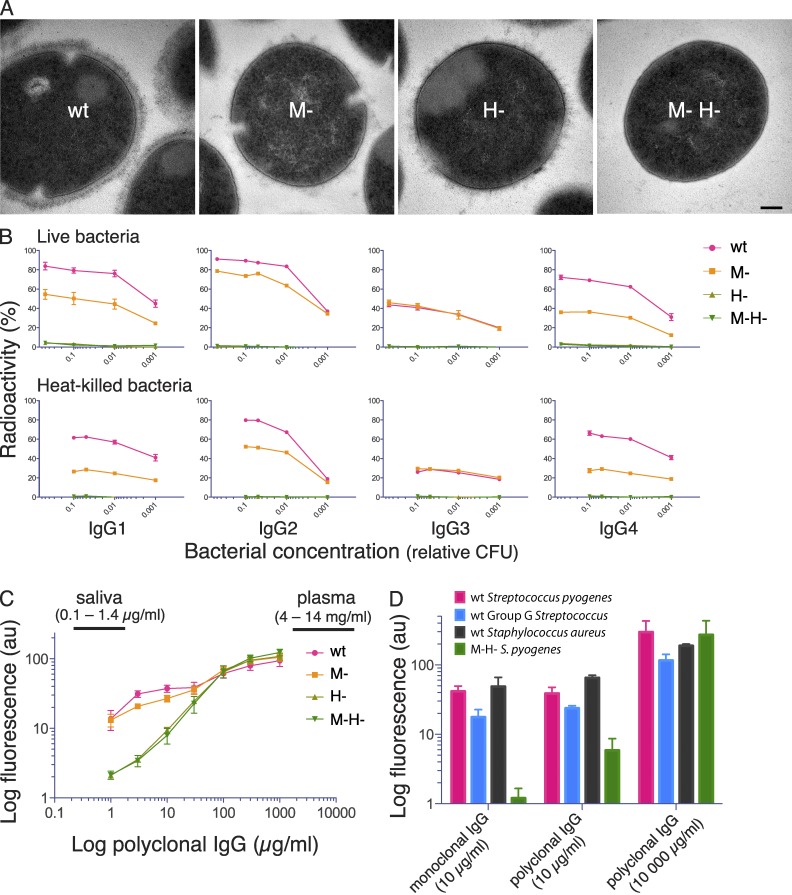
Figure 2.
Electron micrographs of S. pyogenes strains and analysis of bacterial IgG binding. (A) Transmission electron microscopy of wild-type S. pyogenes (wt) and isogenic mutants lacking M1 protein (M-), protein H (H-) and both proteins (M- H-). Bar, 100 nm. (B) 125I-labeled monoclonal IgG subclasses were incubated with live or heat-killed S. pyogenes bacteria that had been harvested at exponential growth phase. IgG binding to bacteria is shown as the percentage of added radiolabeled IgG. Bacterial concentration is given as fractions of 4 × 10⁸ CFU. Data are represented as mean ± SEM of three independent experiments. (C) Wild-type and mutant S. pyogenes bacteria were preincubated with increasing concentrations of pooled polyclonal IgG, and surface-associated IgG was measured by flow cytometry. The range of IgG levels in human plasma and saliva are indicated in the figure. Data are represented as mean ± SEM of three independent experiments. (D) Wild-type and the M-H- S. pyogenes mutant, wild-type protein G–expressing group G Streptococcus, and wild-type protein A–expressing S. aureus, were separately preincubated with monoclonal IgG1 (10 µg/ml) or polyclonal IgG (10 or 10, 000 µg/ml), and surface-bound IgG was measured by flow cytometry. Data are represented as mean ± SEM of three independent experiments.

