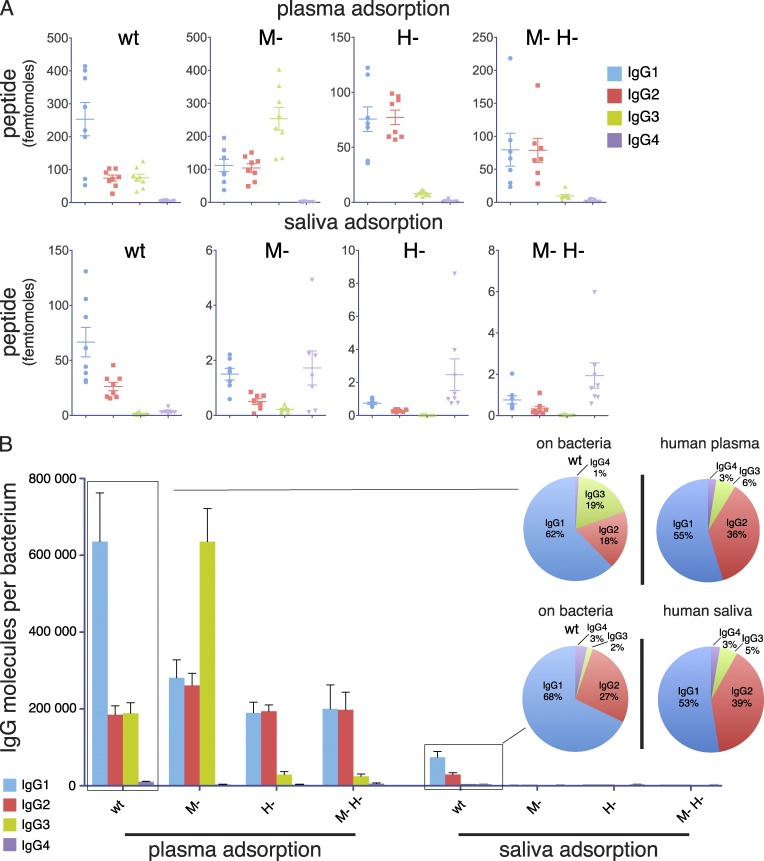
Figure 3.
Profiling of IgG subclass distribution using targeted and quantitative mass spectrometry. (A) Quantification by SRM of IgG bound to the surface of wild-type and mutant S. pyogenes after incubation with either human plasma or saliva. Data are represented as numbers of molecules (femtomole) measured in each paired adsorption experiment (eight independent experiments). (B) Number of IgG molecules per bacterium based on average values from paired samples. The pie charts represent the subclass distribution for IgG bound to wild-type bacteria as compared with the IgG subclass composition of the plasma and saliva samples used for preincubation (eight independent experiments).

