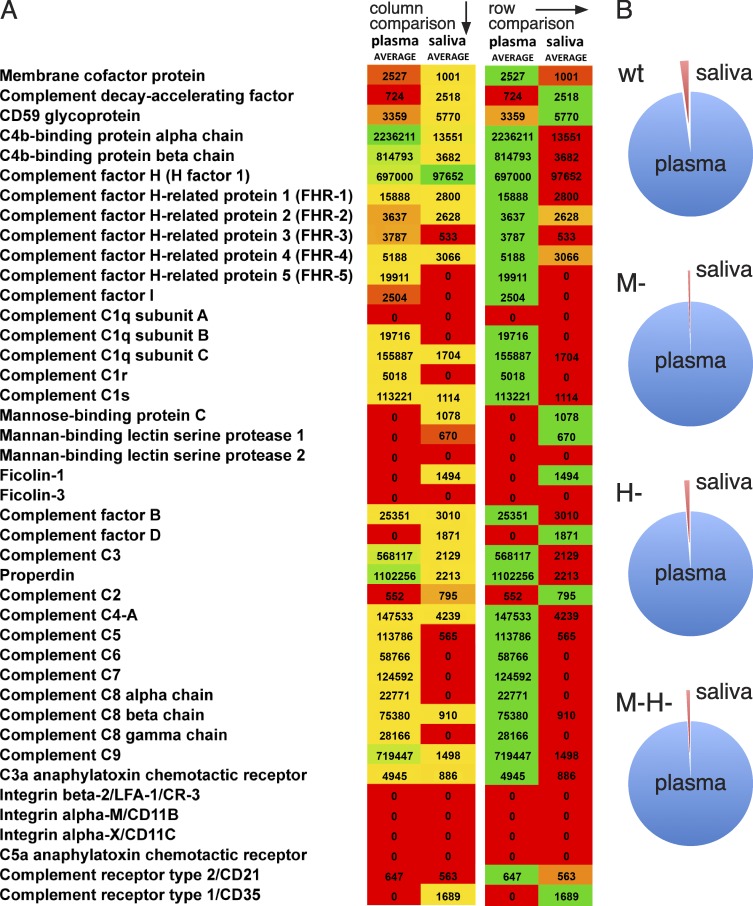
Figure 7.
Complement deposition at the bacterial surface in plasma and saliva. (A) Heat map over bacteria-bound complement proteins from SRM adsorption experiments. Data are represented as mean values from paired adsorption experiments (eight biological replicates with four bacterial strains after incubation with plasma or saliva). The heat map was constructed by comparing values between or within either plasma or saliva conditions. All values <500 were difficult to separate from background noise and were set to 0. Sample peptides were prepared as described in the Materials and methods. (B) Relative complement deposition after plasma or saliva adsorption. Data are represented as percentage of total SRM signal for the mean of eight replicate adsorption experiments (plasma/saliva; wt = 7,091,682/159,629; M- = 7,956,055/41,216; H- = 6,719,836/88,078; M-H- = 6,638,641/56,181).

